Surface Settlements of a Surficial TBM Tunnel
- 4 days ago
- 10 min read
Evaluation with DeepEX software
1. Introduction
Mechanized tunnelling in urban environments requires careful assessment of surface settlements to protect overlying infrastructure and buried utilities. Surface deformations depend on soil stiffness, tunnel geometry, construction method, and time‑dependent consolidation, and are often evaluated using empirical Peck‑type troughs, analytical solutions, or finite element (FEM) models (Peck, 1969). Recent case histories of shield tunnels in soft rock and soil demonstrate that calibrated numerical models can closely reproduce measured settlement profiles and are valuable for parametric studies on design and construction variables (Yuan et al., 2022; Ren et al., 2022).
This note presents a two‑dimensional DeepEX FEM analysis of a shallow TBM tunnel, with emphasis on predicting short‑term and 30‑day consolidated surface settlements. Soil properties and tunnel geometry follow a simplified urban profile with a surficial sand layer overlying a stiff clay deposit, and the tunnel is modelled with a precast segmental lining compatible with typical EPB tunnelling practice (Park, 2018; Mekahlia et al., 2023). The objective is to illustrate how DeepEX can be used to estimate settlement troughs, compare them with computed displacement profiles at three stages (dz ST0–ST3), and visualise post‑construction and time‑dependent settlement patterns.

Figure 1 – Model geometry showing site layout, tunnel position (centre depth 15 m, crown depth 12.3 m), and surface monitoring line for settlement profile extraction.
2. Theoretical Background
2.1 Surface settlement mechanisms in TBM tunnelling
Surface settlement above a TBM tunnel arises mainly from volume loss at the face, around the shield, and in the tail void, as well as from long‑term consolidation in compressible strata (Peck, 1969). For tunnels in soft ground, the transverse settlement trough is commonly approximated by a Gaussian function in which the maximum settlement and trough width parameter are related to the volume loss and tunnel depth (Peck, 1969). Empirical syntheses for soft soils report typical volume losses of 0.5–2.0% for well‑controlled EPB or slurry shields, with narrower troughs in stiffer, more brittle geomaterials (e.g., Park, 2018; Mekahlia et al., 2023).
In soft rock and stiff clays, such as weathered mudstone or overconsolidated clays, three‑dimensional numerical simulations show that deformation is highly sensitive to the deformation modulus and to construction parameters like face pressure and grouting quality (Yuan et al., 2022; Ren et al., 2022). A higher formation stiffness or more effective tail grouting reduces the magnitude of settlements and slightly widens the trough, whereas insufficient pressure or weak grout can lead to localized subsidence and potential ground loss (Yuan et al., 2022).
2.2 Numerical analysis of TBM‑induced settlements
Finite element analyses of shield tunnelling typically discretise the ground with an elastic–plastic soil model (e.g., Mohr–Coulomb, Hardening Soil) and represent the TBM by staged excavation, face pressure, lining installation, and grouting (Yuan et al., 2022; Park, 2018). In double‑line or stacked tunnels, both 2D and 3D simulations have been used to evaluate interaction between headings and to investigate the influence of burial depth, tunnel spacing, and shield thrust on surface settlement (Yuan et al., 2022; Ren et al., 2022).
DeepEX implements plane‑strain FEM with staged construction and allows definition of circular tunnels, segmental linings, and time‑dependent consolidation via equivalent permeability and stiffness parameters. Although 2D models cannot fully reproduce inherently 3D effects such as longitudinal ground loss distribution or shield advance, they provide an efficient framework for preliminary design and sensitivity studies, especially when calibrated against measured settlement troughs or detailed 3D studies (Yuan et al., 2022).

Figure 2 – Conceptual settlement trough (Peck, 1969). S_max = maximum settlement at tunnel centerline, i = trough width parameter, K = i/z₀ = dimensionless shape parameter (typically 0.2-0.8 for stiff clays).
3. Project Description and Modelling Approach
3.1 Soil profile and material parameters
The idealised soil profile consists of a surficial sand deposit overlying a stiff clay layer extending beyond tunnel depth. The sand represents recent urban fill or alluvium, while the clay represents an overconsolidated cohesive formation with high undrained strength and moderate stiffness, consistent with reported profiles for similar urban tunnelling projects (Yuan et al., 2022; Mekahlia et al., 2023). Soil units are modelled with an elastic–plastic formulation; the clay is analysed in undrained terms for short‑term conditions and in effective stress for consolidation. Groundwater is assumed near the interface between sand and clay, with steady‑state conditions and no significant drawdown during tunnelling.
Table 1 – Soil parameters adopted in the DeepEX tunnel model
Material | h (m) | γ (kN/m³) | φ′ (º) | c′ (kPa) | sᵤ (kPa) | E (kPa)/ Eu (kPa) | ν | k (m/s) |
Sand | 0 to 6 | 19 | φ′ = 30 | 0 | -- | 25000 | 0.35 | 1E-4 |
Clay | < 6 | 18 | -- | -- | 30 | 12000 | 0.45 | 1E-9 |
3.2 Tunnel geometry and lining configuration
The tunnel is excavated using an EPB TBM with an internal diameter compatible with a single‑track metro tunnel. In the DeepEX model, the tunnel is represented as a circular section with radius m and lining thickness of 0.30 m, consistent with common segmental tunnel linings in metro projects (Park, 2018; Mekahlia et al., 2023). The tunnel axis is located at an elevation of approximately −15 m, resulting in a cover‑to‑diameter ratio indicative of a surficial urban tunnel.
Segmental ring geometry (number of segments, taper pieces, and gasket type) follows a standard 5+1 configuration, as widely used in EPB tunnels (Park, 2018). The lining is modelled as reinforced concrete with an elastic modulus corresponding to C35/45 concrete; segment joints are idealised as continuous for global deformation analysis.

Figure 3 – Tunnel alignment, depth and circular lining section as implemented in DeepEX.
3.3 FEM model setup in DeepEX
A two‑dimensional plane‑strain model is created representing a longitudinally uniform tunnel section. The model boundaries extend several tunnel diameters horizontally and vertically to minimise boundary effects, and appropriate fixities are assigned at the base and lateral sides. The initial stress field is generated from self‑weight and groundwater.
The TBM‑related construction sequence is simulated through staged activation, following standard practice in tunnel FEM modelling (Yuan et al., 2022; Ren et al., 2022):
Establish initial stresses and pore pressures in the ground.
Excavate the circular tunnel core by deactivating soil elements within the tunnel boundary.
Activate the segmental lining and surrounding grout layer with appropriate stiffness.
Apply equivalent internal pressures or imposed displacements to represent TBM face support and tail grouting, calibrated to produce realistic volume loss.
Surface monitoring points are defined along a line above the tunnel axis from approximately m to m, allowing direct extraction of settlement profiles corresponding to stages ST1, ST2, and ST3. The model is first solved for short‑term (undrained) conditions immediately after lining installation, and subsequently for a 30‑day consolidation period to capture time‑dependent settlements in the clay, similar to the approach adopted by Yuan et al. (2022).

Figure 4 – DeepEX model view showing soil layers and tunnel position.
4. Numerical Results
4.1 Short‑term surface settlement troughs
Figure 5 presents the transverse settlement trough at the ground surface obtained from the FEM analysis for three stages, plotted using the values listed in Table 2. Settlements are expressed in centimetres and distances are measured from the tunnel axis along the ground surface. The three curves dz(ST1), dz(ST2) and dz(ST3) represent successive stages of the analysis, with settlements increasing toward the tunnel and the largest values occurring near m. At that location the calculated settlements are approximately 3.36 cm for ST1, 4.07 cm for ST2 and 4.44 cm for ST3.

Figure 5 – Surface settlement profiles dz(ST1), dz(ST2) and dz(ST3) versus distance from tunnel axis.
Table 2 – Surface settlements used for Figure 5.
X (m) | dz(ST1) (cm) | dz(ST2) (cm) | dz(ST3) (cm) |
−50.000 | 0.157 | 0.156 | 0.215 |
−45.403 | 0.228 | 0.259 | 0.341 |
−40.806 | 0.355 | 0.430 | 0.542 |
−35.059 | 0.631 | 0.803 | 0.966 |
−30.462 | 1.011 | 1.307 | 1.524 |
−25.864 | 1.629 | 2.067 | 2.344 |
−20.118 | 2.783 | 3.418 | 3.762 |
−16.670 | 3.295 | 4.001 | 4.366 |
−15.520 | 3.346 | 4.057 | 4.424 |
−14.944 | 3.356 | 4.069 | 4.437 |
Comparison of the curves indicates that, as the tunnel construction and consolidation progress from ST1 to ST3, the settlement trough deepens while retaining a smooth, continuous shape. This behaviour is consistent with field observations from EPB tunnels in stiff clays and mudstones, where increasing volume loss or progressive consolidation primarily affects while the trough width remains relatively stable (Park, 2018; Yuan et al., 2022).
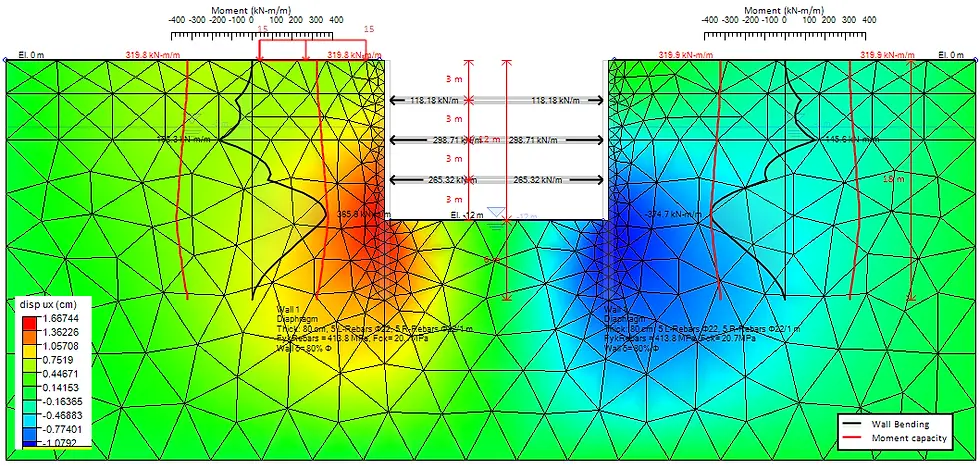
4.2 Segmental joint stresses and volume loss (Stages 2 and 3)
The DeepEX output for stages 2 and 3 also provides estimates of segmental joint compressive stresses and associated volume loss for each ring. In stage 2, after tunnel excavation and lining installation, joint compressive stresses range roughly between 4.4 and 8.8 MPa, with the highest values near the crown side where overburden and TBM thrust combine, while the stage volume loss is essentially zero (δV ≈ 0%), reflecting the assumption of full-face support and effective tail grouting. In stage 3, after consolidation and slight redistribution of loads, joint stresses are of similar magnitude (about 4.4–8.6 MPa) but shift modestly around the ring shoulders, and the calculated stage volume loss remains very small (δV ≈ 0.01%), indicating negligible additional loss of ground.

Figure 6 – Segmental joint stress vectors and δV at Stage 2.
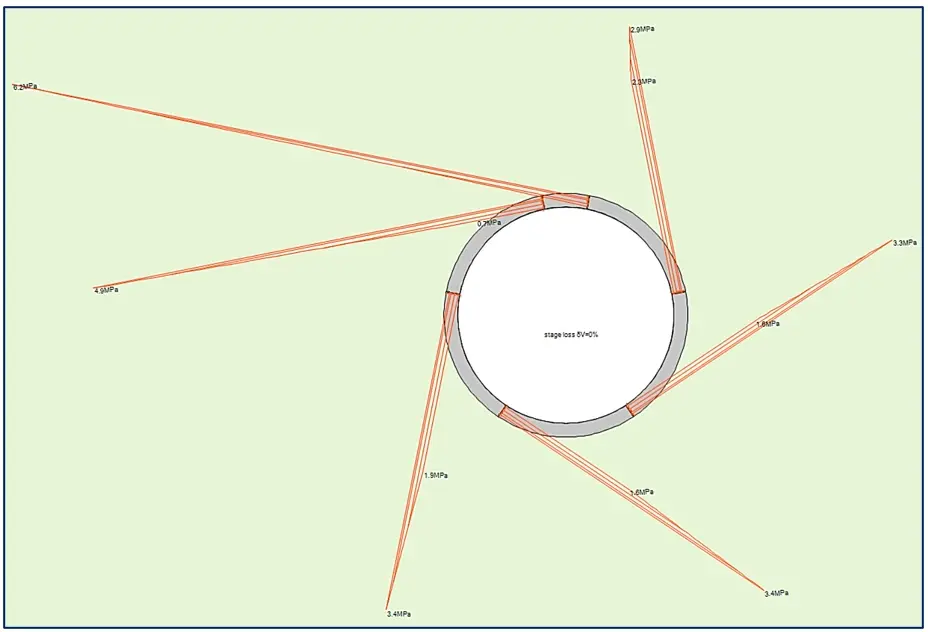
Figure 7 – segmental joint stress vectors and δV at Stage 3.
4.3 Consolidation settlements after 30 days
To evaluate time‑dependent behaviour, the model is advanced 30 days under constant total stress conditions, allowing pore pressure dissipation in the clay. The resulting consolidation settlements are superimposed on the construction‑induced displacements and correspond to the dz(ST3) profile in Figure 5. The results show additional settlements mainly concentrated above the tunnel crown, with incremental displacements typically a few tenths of a centimetre compared with the short‑term state and diminishing with distance from the tunnel. This pattern is consistent with reported behaviour of shield tunnels in weathered mudstone and stiff clays, where consolidation produces moderate additional settlements without fundamentally changing the trough shape (Yuan et al., 2022; Ren et al., 2022).
In addition to the vertical settlements, the FEM results show relatively small horizontal ground movements at the surface after 30 days. At the monitoring point above the tunnel axis, peak horizontal displacements are about ±0.62 cm in ST3 and ±0.55 cm in ST2, representing roughly 13–15% of the corresponding maximum vertical settlements of 4.44 cm and 4.07 cm, respectively. The displacement field is essentially symmetric about the tunnel axis, with equal but opposite movements on each side, indicating that surface deformation is dominated by vertical subsidence rather than lateral translation of the ground mass. From a serviceability standpoint, these limited horizontal movements are unlikely to govern the response of typical surface structures when compared with the vertical settlement component.

Figure 8 – Surface settlement contours and shading after tunnel construction.
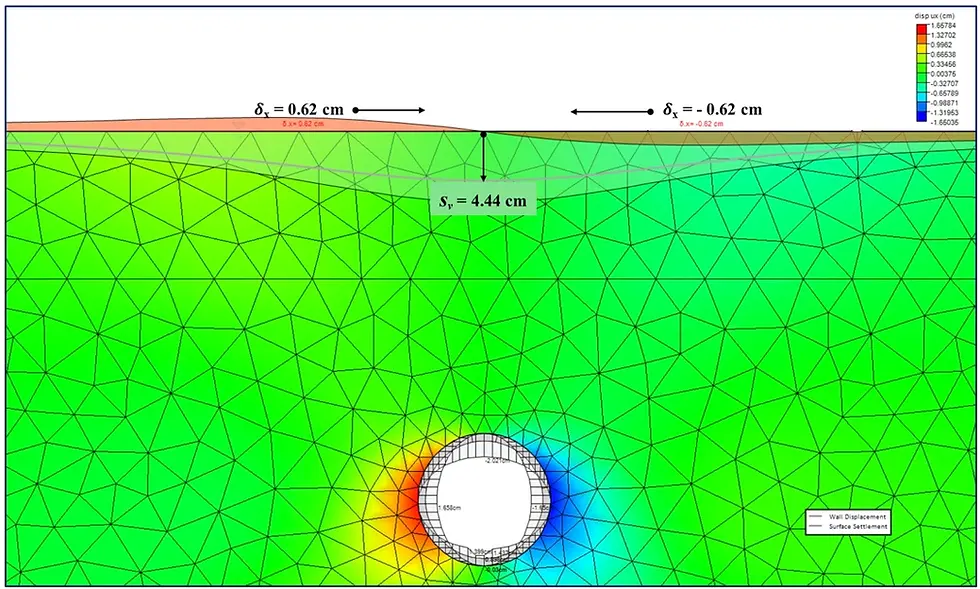
Figure 9 – Surface settlement contours after 30 days of consolidation.
A summary table can synthesise the key results of the DeepEX analysis, including maximum settlements, trough widths, and settlement at selected offsets for both short‑term and 30‑day conditions.
Table 3 – Summary of FEM‑predicted maximum settlement and characteristic parameters for ST1, ST2 and ST3.
Stage | Max. vertical settlement (cm) | Location of (m from tunnel axis) | Comments |
ST1 | 3.36 | −15.0 | Short‑term state just after excavation and lining installation. |
ST2 | 4.07 | −15.0 | Intermediate stage with slightly reduced settlements compared with ST3 contours. |
ST3 | 4.44 | −15.0 | 30‑day state including consolidation; deepest settlement trough. |
5. Discussion
The DeepEX analysis confirms the strong influence of soil stiffness and consolidation properties on both vertical and horizontal ground movements above a shallow TBM tunnel. The dominance of clay deformation modulus on settlement magnitude, observed in published 3D simulations of similar tunnels, is reflected in the progressive deepening of the settlement trough from ST1 (3.36 cm) to ST3 (4.44 cm) as construction advances and consolidation occurs (Yuan et al., 2022). Adjusting clay stiffness within realistic bounds provides effective calibration to match target dz(ST3) profiles while maintaining realistic trough shapes.
The symmetric horizontal displacement field (±0.55–0.62 cm), representing only 13–15% of maximum vertical settlements, confirms volume-loss-dominated behaviour typical of well-controlled EPB tunnelling in stiff ground. This limited lateral spreading contrasts with cases of poor face control or excessive volume loss, where horizontal movements can approach 25–50% of vertical settlement and become serviceability-limiting for adjacent structures (Park, 2018).
Segmental joint stresses of 4.4–8.8 MPa across stages 2–3 remain well within capacity of standard C35/45 concrete segments, while the near-zero volume loss (δV ≈ 0–0.01%) validates the effectiveness of the modelled TBM face pressure and tail grouting assumptions. The plane-strain approach successfully captures these global ring forces despite simplifying inherently 3D construction effects.
The ability to superimpose consolidation effects over staged construction provides particular value in stiff clay environments, where short-term undrained settlements (ST1/ST2) significantly underestimate 30-day totals (ST3). For projects with tight settlement tolerances, this incremental consolidation component, adding ~1.08 cm to maximum settlement (from ST1 = 3.36 cm to ST3 = 4.44 cm), may govern decisions on minimum cover depth, tunnel alignment, or targeted ground improvement above the crown.
While 2D modelling cannot replicate longitudinal settlement progression or shield advance dynamics, it offers an efficient platform for integrated assessment of settlement envelopes, lining integrity, volume loss control, and time-dependent effects. The results underscore DeepEX's utility as a practical design and verification tool when anchored to reliable soil data and calibrated against empirical benchmarks from comparable projects.
6. Conclusions
This study demonstrates the application of DeepEX 2D FEM for comprehensive evaluation of surface settlements and associated ground movements induced by a surficial TBM tunnel in a layered sand-clay profile. By incorporating realistic soil parameters, segmental lining geometry, and staged construction with consolidation analysis, the model produces settlement troughs and displacement patterns consistent with established case histories of shield tunnels in stiff geomaterials (Yuan et al., 2022; Park, 2018). The analysis captures progressive deepening from ST1 (3.36 cm max.) through ST3 (4.44 cm max.) due to excavation, lining installation, and 30-day consolidation.
The analysis captures three key aspects of tunnel-induced ground response: (1) progressive deepening of the settlement trough from ST1 (3.36 cm max.) through ST3 (4.44 cm max.) due to excavation, lining installation, and 30-day consolidation; (2) very low segmental joint stresses (4.4–8.8 MPa) and negligible volume loss (δV ≈ 0–0.01%) reflecting effective TBM face support and tail grouting; and (3) symmetric horizontal surface movements (±0.55–0.62 cm) representing only 13–15% of maximum vertical settlements, confirming volume-loss-dominated behaviour rather than significant lateral spreading.
Short-term analyses effectively isolate immediate construction effects, while the consolidation phase reveals additional time-dependent settlements critical for long-term serviceability assessment. The symmetric displacement field and limited horizontal movements indicate that vertical settlement governs structural response for typical surface infrastructure.
DeepEX provides an efficient, integrated framework for preliminary TBM tunnel design that combines surface settlement prediction, lining stress evaluation, volume loss assessment, and time-dependent consolidation effects. When supported by reliable geotechnical characterisation and careful calibration against target settlement envelopes, the approach enables optimised tunnel geometry, cover depth selection, and construction controls while maintaining surface deformations within acceptable serviceability limits.
References
Mekahlia, A., et al. (2023). Analysis of surface settlements induced by tunnel excavation with EPB‑TBM. New Technologies in Mining, Geology and Environmental Protection, 1, 3–14.
Park, J. (2018). Monitoring and analysis of ground settlement induced by stacked twin‑tunnel construction using a slurry TBM. Mathematical Problems in Engineering, Article 5879402.
Peck, R. B. (1969). Deep excavations and tunneling in soft ground. In Proceedings of the 7th International Conference on Soil Mechanics and Foundation Engineering (State‑of‑the‑Art Volume).
Ren, X., et al. (2022). Numerical simulation of ground surface settlement caused by double‑line shield tunneling. Frontiers in Earth Science, 10, 937524.
Yuan, C., Zhang, M., Ji, S., Li, J., & Jin, L. (2022). Analysis of factors influencing surface settlement during shield construction of a double‑line tunnel in a mudstone area. Scientific Reports, 12, 22606.
Trusted By


Still not persuaded? Let us show you how to reduce your design time by up to 90%!