

DeepEX FEM Comparison of Sheet Pile Excavations
Strutted excavation in sand and anchored excavation in clay
Comparison with independent finite element results from Sponthandboken
Maximum wall moments differ by 0.2% in Example 1 and 1.4% in Example 2. In the revised clay example, the anchor reaction differs by 0.8%, while peak absolute shear and displacement fields show larger differences.
Deep Excavation LLC Technical comparison report Revised 7 October 2026
1. Introduction
This report compares two sheet pile excavation examples analysed in DeepEX with corresponding results obtained using an independent finite element program, referred to throughout as Comparison FEM. The examples are a strutted excavation in sand and an anchored excavation in clay over bedrock, adapted from worked examples in Sponthandboken on pages H18 and H38.
The comparison examines wall bending moments, shear forces, support reactions and displacement extrema. The maximum bending moment differs by 0.2% in Example 1 and 1.4% in Example 2. The revised Example 2 anchor reaction also agrees closely, with a difference of 0.8%. The remaining results are assessed individually in the comparison tables and discussion.
2. Methodology
The response results compared in this report were obtained using two-dimensional FEM analysis in both programs. Both examples use the Mohr–Coulomb constitutive model. The wall geometry, soil description and support arrangement were reproduced in DeepEX, with the illustrated soil and structural inputs presented under Description of the Analysis.
For Example 2, one preliminary DeepEX run combining FEM and limit equilibrium analysis (FEM+LEM) was conducted to assess the wall embedment. The revised FEM comparison adopts the wall toe at the bedrock surface, 15 m below ground level. This gives 11.5 m of embedment below the 3.5 m deep excavation base.
The comparison uses the baseline FEM response quantities. The separately factored design forces and the soil-strength-reduced results included in the reference examples are not mixed with these values. Wall and support forces are expressed per metre of wall, and displacement values are expressed in centimetres.
Signed extrema are listed as maximum and minimum values. Peak shear is also compared using the largest absolute value because the shear signs differ between the programs in Example 2. Percentage differences use the Comparison FEM magnitude as the baseline: . Here D and C denote the DeepEX and Comparison FEM results. Positive percentages indicate a larger DeepEX magnitude and negative percentages a smaller magnitude. Wall deflection, displacement field extrema and the settlement summary are identified separately to preserve their extraction basis.
3. Description of the Analysis
Example 1. Strutted sheet pile wall in sand
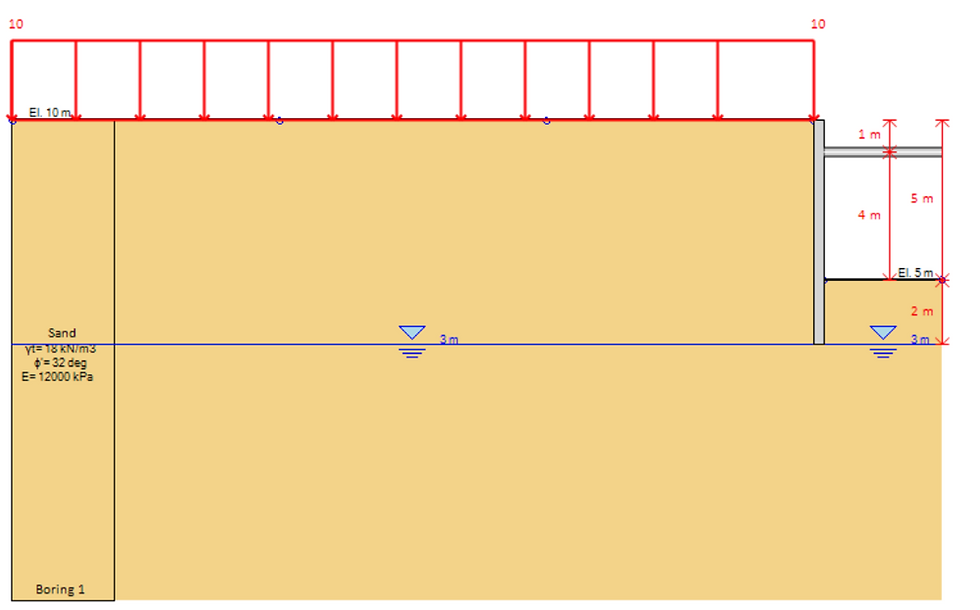
Example 1 represents an 8 m wide excavation supported by a VL601 sheet pile wall and HEB 180 struts at 5 m spacing. The retained ground is at elevation +10 m, the support is at +9 m, the final excavation level is +5 m, and the wall toe is at +3 m. The resulting excavation depth is 5 m and the toe is embedded 2 m below the excavation base. A uniform 10 kPa surcharge acts on the retained side.
Table 1. Soil and loading inputs for Example 1.
Parameter | Adopted value |
Constitutive model | Mohr–Coulomb |
Soil type | Sand |
Effective friction angle φ′ | 32° |
Young modulus E | 12,000 kPa |
Total unit weight γ | 18 kN/m³ |
At rest coefficient K0 | 0.47 |
DeepEX water level on both sides | +3.0 m |
Uniform surcharge | 10 kPa |
Table 2. Wall and support properties for Example 1.
Structural parameter | Value |
Sheet pile section | VL601 |
Reference wall axial rigidity EA | 1.966 × 10⁶ kN/m |
Reference wall bending rigidity EI | 22.99 × 10³ kN·m²/m |
Strut section | HEB 180 |
Horizontal strut spacing | 5.0 m |
Strut elevation | +9.0 m |
The FEM model represents the soil as a homogeneous sand layer. The wall and strut system is activated during the staged excavation analysis, and the compared results correspond to the final excavation condition. Figure 1 shows the reproduced DeepEX model geometry.
Example 1. Geometry
Example 1. Construction sequence
The DeepEX sequence starts with the wall present, the strut inactive and the 10 kPa surcharge applied. The strut is activated after excavation to elevation +8.5 m. Groundwater remains at elevation +3.0 m on both sides throughout. Table 3 describe the five illustrated construction steps.
Table 3. Construction sequence and hydraulic conditions for Example 1.
Step | Excavation depth (m) | Excavation elevation (m) | Water level on excavation side (m) | Support condition |
1 | 0.0 | +10.0 | +3.0 | Initial state; strut inactive |
2 | 1.5 | +8.5 | +3.0 | Strut inactive |
3 | 1.5 | +8.5 | +3.0 | Activate strut at +9.0 m |
4 | 2.5 | +7.5 | +3.0 | Strut active |
5 | 5.0 | +5.0 | +3.0 | Strut active |
Example 2. Anchored sheet pile wall in clay
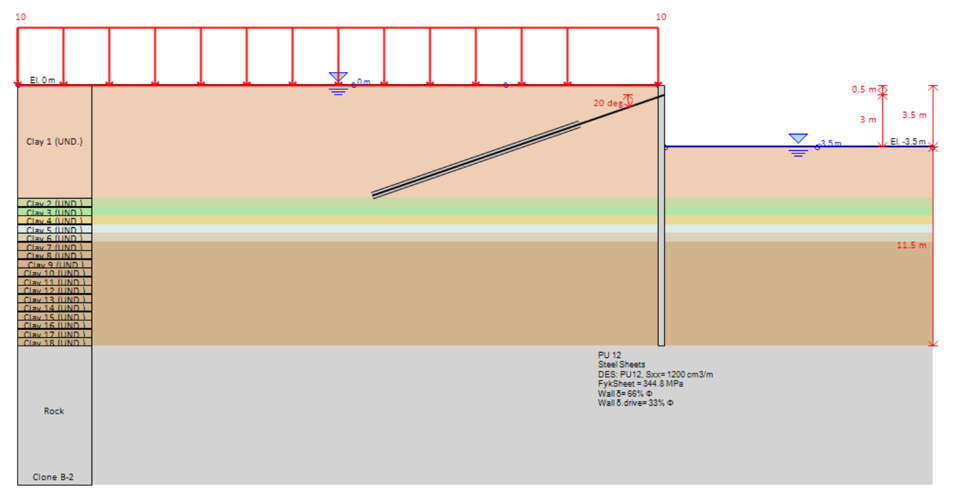
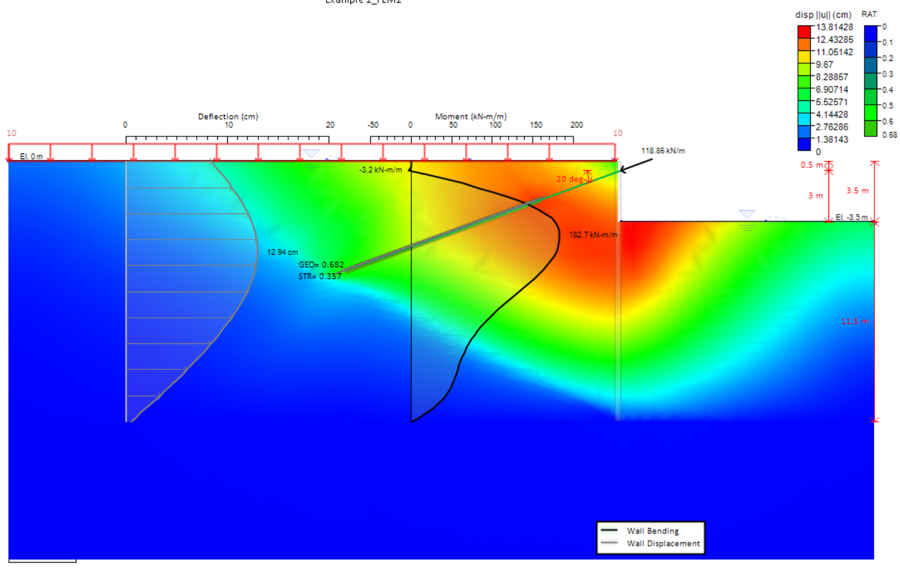
Example 2 represents a PU 12 sheet pile wall supporting a 3.5 m deep excavation in clay, with bedrock at elevation −15.0 m. The retained ground is at elevation 0 m. One level of tieback anchors is installed at −0.5 m, at 3 m horizontal spacing and an inclination of 20° below horizontal, as shown in the revised DeepEX geometry. The reference anchor section is T76N 180, with a stated prestress of 240 kN per anchor. A permanent 10 kPa surcharge acts on the retained side and is included in the initial stage.
Table 4. Soil and hydraulic inputs for Example 2.
Parameter | Value |
Constitutive model | Mohr–Coulomb |
Clay strength description | Undrained strength cu |
At rest coefficient K0 | 0.60 |
Layer stiffness relation | E = 250 cu |
Clay unit weight γ | 16 kN/m³ |
DeepEX water level initial stage | 0.0 m |
Bedrock surface elevation | −15.0 m |
The clay is represented as a stratified deposit with 18 homogeneous input layers. Clay 1 extends from ground level to 6.5 m depth; 17 further layers, each 0.5 m thick, extend from 6.5 m to the bedrock surface at 15 m depth. An undrained Mohr–Coulomb response is adopted for the clay.
A representative undrained strength and elastic modulus are assigned to each layer at its midpoint depth z, measured positively downwards from ground level. The strength is 10 kPa down to 6.5 m; below that depth, , with strength in kPa and depth in metres. The layer modulus follows . Table 4 lists the rounded values used for the layer description; E is calculated from the unrounded midpoint strength before rounding.
Example 2. Layering and embedment
Table 5. Midpoint strength and stiffness values for the 18 clay layers in Example 2.
Layer | Top elevation (m) | Base depth (m) | Midpoint z (m) | cu (kPa) | E (kPa) |
Clay 1 | 0.0 | 6.5 | 3.25 | 10.0 | 2,500 |
Clay 2 | 6.5 | 7.0 | 6.75 | 10.4 | 2,597 |
Clay 3 | 7.0 | 7.5 | 7.25 | 11.2 | 2,791 |
Clay 4 | 7.5 | 8.0 | 7.75 | 11.9 | 2,984 |
Clay 5 | 8.0 | 8.5 | 8.25 | 12.7 | 3,178 |
Clay 6 | 8.5 | 9.0 | 8.75 | 13.5 | 3,372 |
Clay 7 | 9.0 | 9.5 | 9.25 | 14.3 | 3,566 |
Clay 8 | 9.5 | 10.0 | 9.75 | 15.0 | 3,759 |
Clay 9 | 10.0 | 10.5 | 10.25 | 15.8 | 3,953 |
Clay 10 | 10.5 | 11.0 | 10.75 | 16.6 | 4,147 |
Clay 11 | 11.0 | 11.5 | 11.25 | 17.4 | 4,341 |
Clay 12 | 11.5 | 12.0 | 11.75 | 18.1 | 4,534 |
Clay 13 | 12.0 | 12.5 | 12.25 | 18.9 | 4,728 |
Clay 14 | 12.5 | 13.0 | 12.75 | 19.7 | 4,922 |
Clay 15 | 13.0 | 13.5 | 13.25 | 20.5 | 5,116 |
Clay 16 | 13.5 | 14.0 | 13.75 | 21.2 | 5,309 |
Clay 17 | 14.0 | 14.5 | 14.25 | 22.0 | 5,503 |
Clay 18 | 14.5 | 15.0 | 14.75 | 22.8 | 5,697 |
Bedrock | 15.0 | — | — | — | — |
All clay depths in Table 4 are measured below ground level; elevations therefore have the opposite sign. Bedrock begins at 15.0 m depth. The retained bedrock inputs are a unit weight of 27 kN/m³, cohesion of 100 kPa, friction angle of 30° and elastic modulus of 479,000 kPa.
Table 6. Wall and anchor properties for Example 2.
Structural parameter | Value |
Sheet pile section | PU 12 |
Reference wall axial rigidity EA | 2.94 × 10⁶ kN/m |
Reference wall bending rigidity EI | 31.75 × 10³ kN·m²/m |
Reference anchor section | T76N 180 |
Anchor horizontal spacing | 3.0 m |
Anchor inclination | 20° |
Stated anchor prestress per anchor | 240 kN |
Wall toe elevation | −15.0 m |
Wall length below ground level | 15.0 m |
Embedment below excavation base | 11.5 m |
The sheet pile toe is placed at the bedrock surface, at a depth of 15 m, without penetration into the rock. Driving the sheet piles into bedrock is not considered feasible for this example. The embedment below the excavation base is therefore 15.0 − 3.5 = 11.5 m. This geometry is adopted for the revised FEM analysis.
Example 2. Geometry
Example 2. Construction sequence
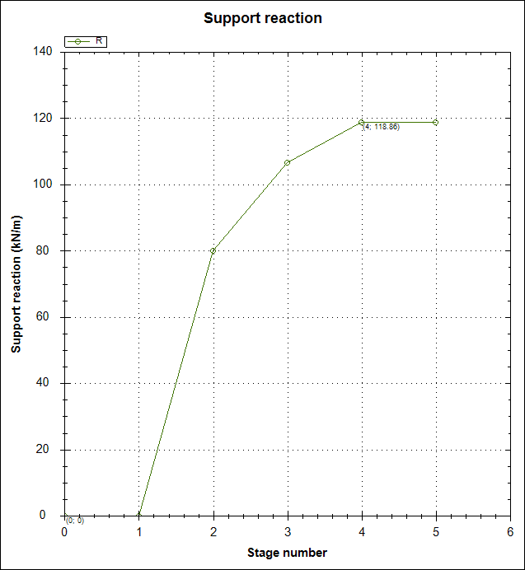
The wall is present and the 10 kPa surcharge is applied in the initial state, with the anchor inactive. Excavation first reaches −1.5 m, after which the anchor is activated at −0.5 m. Its illustrated prestress of 80 kN/m corresponds to 240 kN per anchor at 3 m spacing. Excavation then reaches −3.0 m and −3.5 m. The retained-side water level stays at 0 m, while the excavation-side water level follows the excavation level. Table 7 describes this sequence.
Table 7. Construction sequence and hydraulic conditions for Example 2.
Step | Excavation depth (m) | Excavation elevation (m) | Water level onexcavation side (m) | Support condition |
1 | 0.0 | 0.0 | 0.0 | Initial state; anchor inactive |
2 | 1.5 | −1.5 | −1.5 | Anchor inactive |
3 | 1.5 | −1.5 | −1.5 | Activate anchor at −0.5 m |
4 | 3.0 | −3.0 | −3.0 | Anchor active |
5 | 3.5 | −3.5 | −3.5 | Anchor active |
4. Results and Discussion
Example 1. Comparison of FEM results
Table 8. FEM result extrema and percentage differences for Example 1.
Response | DeepEXMax | DeepEXMin | ComparisonFEM Max | ComparisonFEM Min | Δ Max (%) | Δ Min (%) |
Wall moment (kN·m/m) | 39.9 | −2.8 | 39.82 | −12.81 | +0.2 | -78.1 |
Wall shear (kN/m) | 31.7 | −26.8 | 34.33 | −30.34 | -7.7 | -11.7 |
Strut reaction (kN/m) | 33.61 | 33.61 | 58.00 | 58.00 | -42.1 | -42.1 |
Horizontal displacement (cm) | 0.68 | −0.38 | 1.101 | −0.01 | -38.2 | +3700.0 |
Vertical displacement (cm) | 5.07 | −1.169 | 2.937 | −0.7566 | +72.6 | +54.5 |
The strut value is a single reaction, repeated in both extrema columns. The reference vertical minimum is converted from −7.566 × 10⁻³ m to −0.7566 cm. Percentage differences compare magnitudes. The +3700.0% horizontal minimum reflects the small reference magnitude of 0.01 cm and is sensitive to rounding; the absolute values are more informative for that extremum.
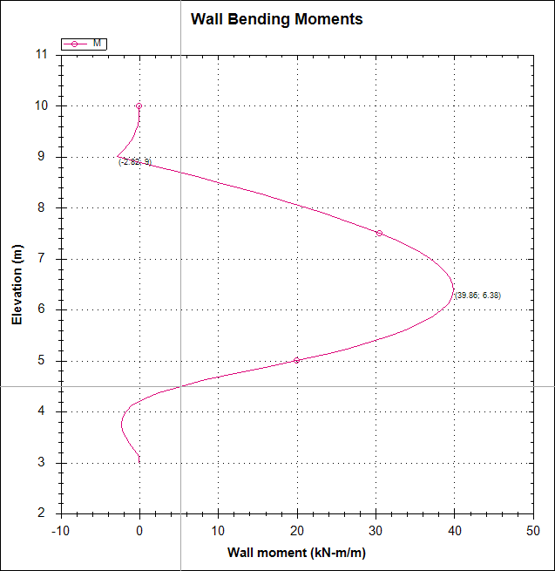
DeepEX gives a maximum bending moment of 39.9 kN·m/m, compared with 39.82 kN·m/m in Comparison FEM, a difference of 0.08 kN·m/m or 0.2%. The negative moment magnitudes differ more substantially, at 2.8 and 12.81 kN·m/m. Agreement in the governing positive moment therefore does not establish agreement across the full moment diagram.
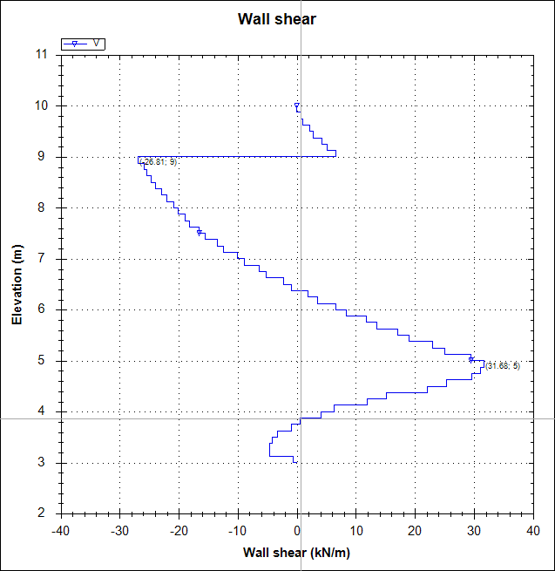
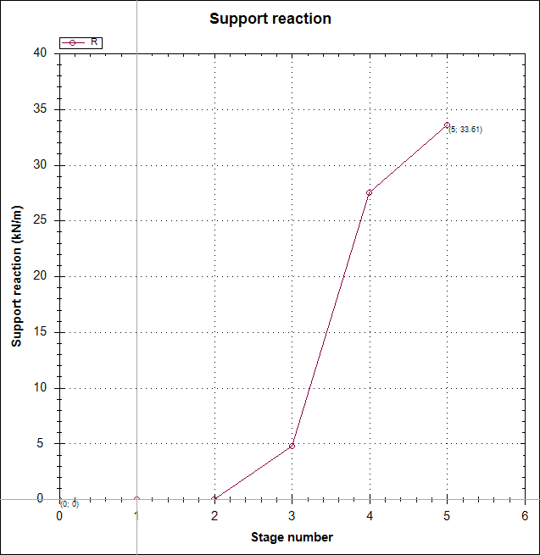
The peak absolute shear is 31.7 kN/m in DeepEX and 34.33 kN/m in Comparison FEM, with DeepEX 7.7% lower. The negative shear magnitudes are 26.8 and 30.34 kN/m. These differences are smaller than the support-reaction difference: the DeepEX strut reaction is 33.61 kN/m, compared with 58.00 kN/m, or 42.1% lower.
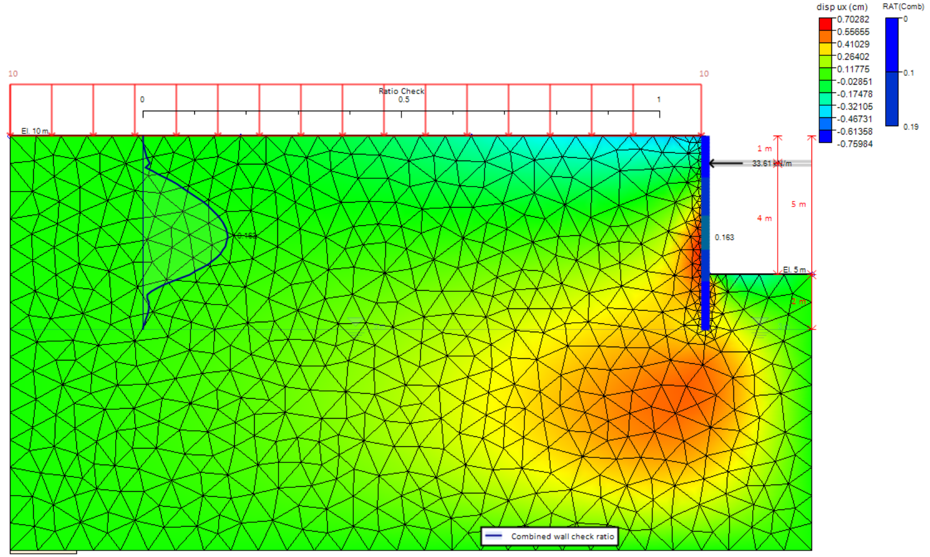
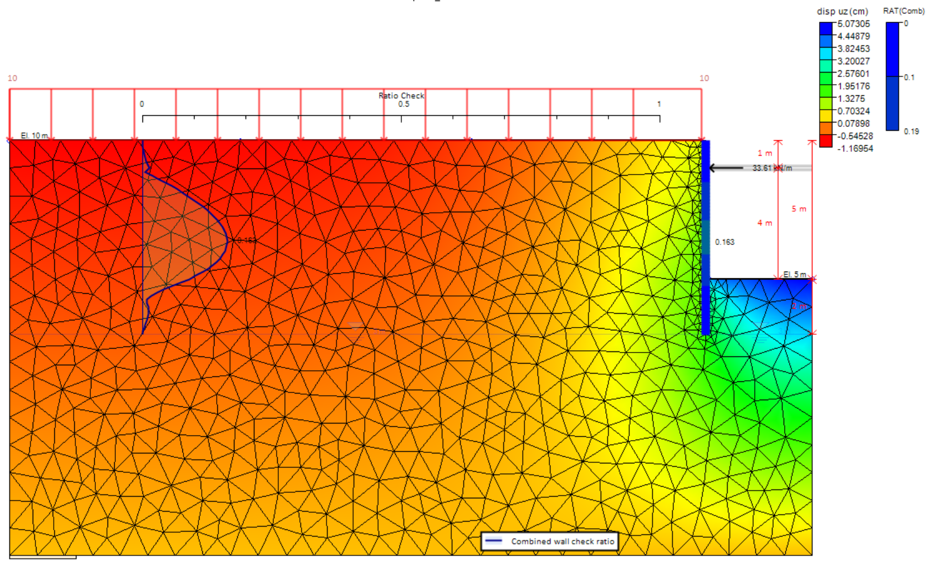
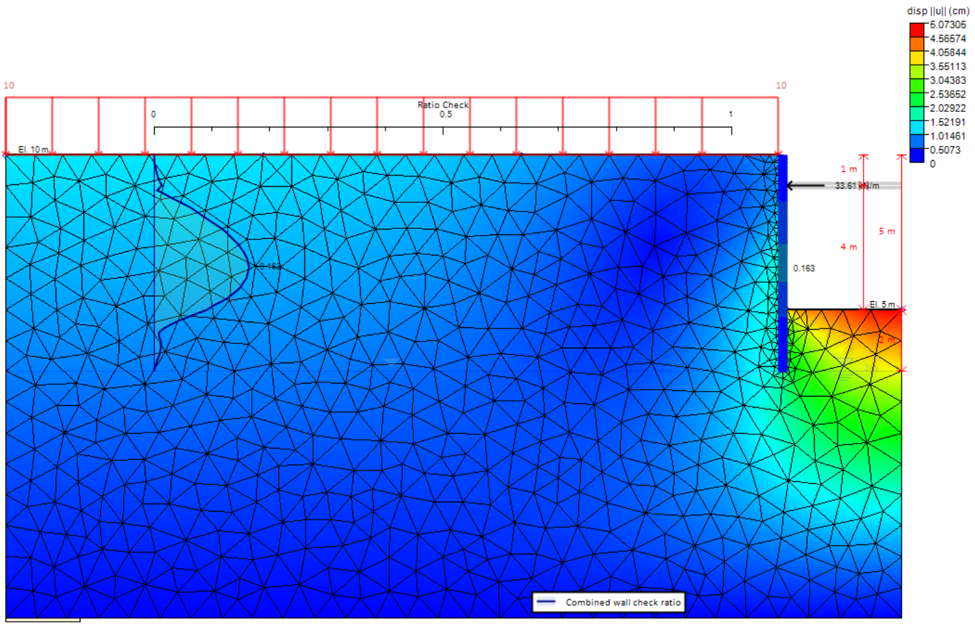
The maximum horizontal displacement is 0.68 cm in DeepEX and 1.101 cm in Comparison FEM, making the DeepEX value 38.2% lower. The positive vertical extremum is 5.07 cm rather than 2.937 cm, or 72.6% higher. The negative vertical displacement magnitudes are 1.169 and 0.7566 cm, a difference of 54.5%. The displacement fields therefore require a separate assessment from the closely matching maximum bending moment.
Figures 3 to 8 show the wall-force diagrams, movement fields and staged support reaction. The lower strut reaction and different displacements point to a need to align support stiffness and activation, initial stresses, hydraulic conditions and the displacement extraction locations before attributing the differences to the FEM formulations. The reported extrema alone do not isolate their cause.
Example 1. Wall forces
Example 1. Horizontal and vertical displacement
The horizontal and vertical displacement contours show how movements vary across the DeepEX model. The numerical comparison with the independent FEM results is presented in Table 6.
Example 1. Total displacement and strut reaction
Example 2. Comparison of FEM results
Table 9. Revised FEM result extrema and percentage differences for Example 2.
Response | DeepEXMax | DeepEXMin | ComparisonFEM Max | ComparisonFEM Min | Δ Max (%) | Δ Min (%) |
Wall moment (kN·m/m) | 182.68 | −3.19 | 185.3 | −3.325 | -1.4 | -4.1 |
Wall shear (kN/m) | 40.57 | −94.69 | 105.8 | −53.1 | -61.7 | +78.3 |
Peak absolute wall shear (kN/m) | 94.69 | — | 105.8 | — | -10.5 | — |
Anchor reaction (kN/m) | 118.86 | 118.86 | 119.8 | 119.8 | -0.8 | -0.8 |
Wall deflection (cm) | 12.94 | 0.46 | — | — | — | — |
Horizontal field displacement (cm) | 12.9891 | 0.0000 | 10.25 | −0.07018 | +26.7 | -100.0 |
Vertical field displacement (cm) | 8.8352 | −6.4315 | 9.507 | −8.811 | -7.1 | -27.0 |
Wall values come from the revised diagrams and Stage 5 summary; field extrema come from the contours. The reference horizontal minimum is −0.07018 cm. A dash identifies a value unavailable on the same extraction basis. Anchor reactions are repeated in both extrema columns.
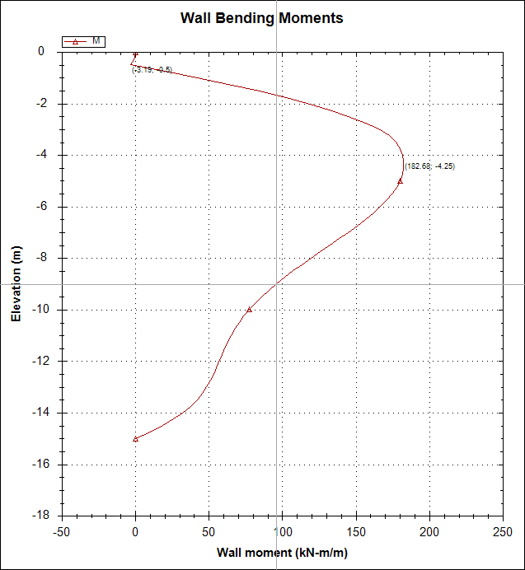
The maximum bending moment is 182.68 kN·m/m in DeepEX and 185.3 kN·m/m in Comparison FEM. DeepEX is 2.62 kN·m/m, or 1.4%, lower. The negative moment magnitudes are 3.19 and 3.325 kN·m/m, respectively, a difference of 4.1%. Both moment extrema therefore agree more closely than the shear branches in the revised model.
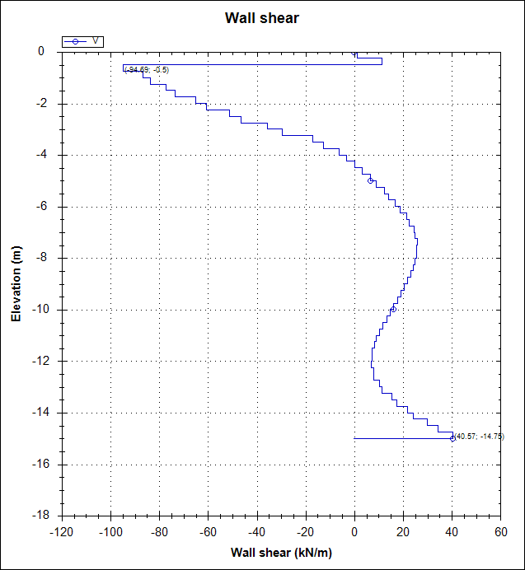
DeepEX gives shear extrema of +40.57 and −94.69 kN/m, while Comparison FEM gives +105.8 and −53.1 kN/m. The largest absolute shear is 94.69 kN/m in DeepEX and 105.8 kN/m in Comparison FEM, making DeepEX 10.5% lower. The percentages for the signed branches are also listed, but their interpretation depends on aligning the local axes and force-sign conventions.
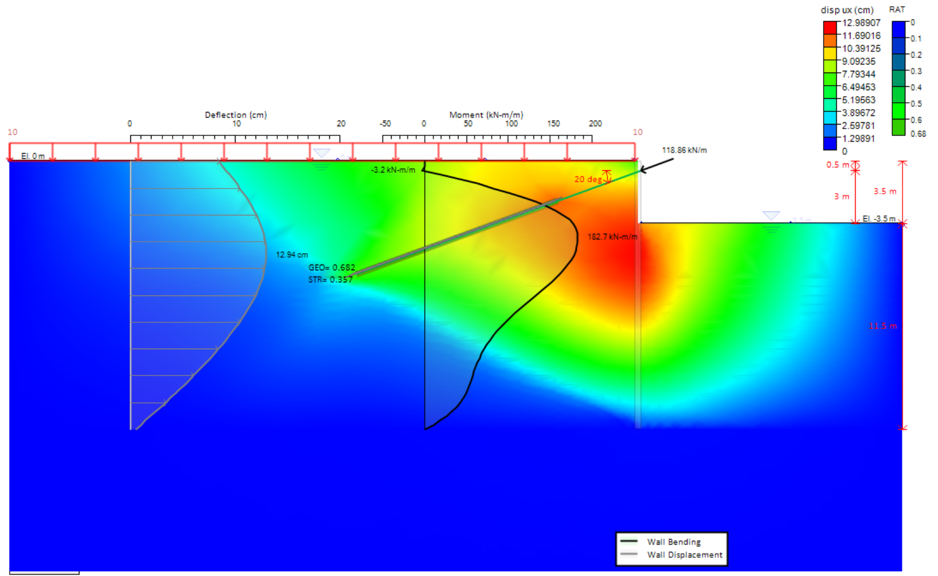
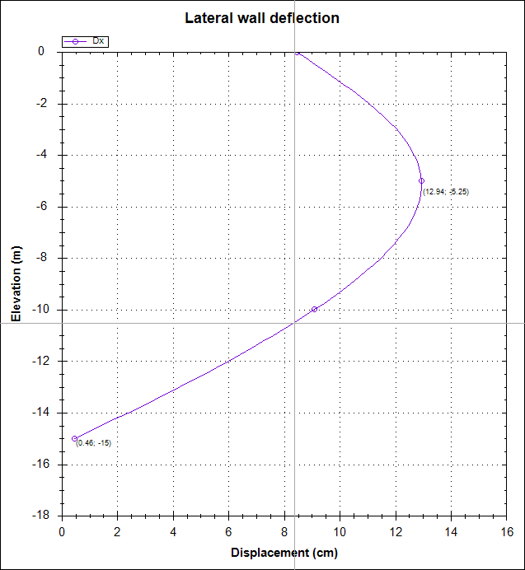
The anchor reaction is 118.86 kN/m in DeepEX and 119.8 kN/m in Comparison FEM, or 0.8% lower. DeepEX wall deflection reaches 12.94 cm at elevation −5.25 m, with 0.46 cm at the toe. The horizontal field maximum is 12.9891 cm versus 10.25 cm, or 26.7% higher. Comparison FEM reports field extrema without a separate wall profile, so the field maxima are compared on the same basis.
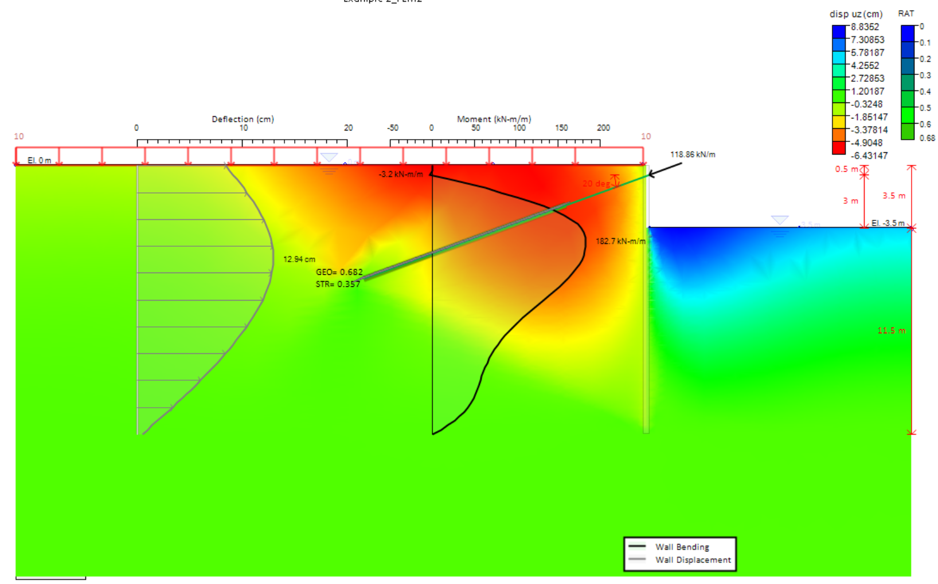
The positive vertical field extremum is 8.8352 cm in DeepEX versus 9.507 cm in Comparison FEM, or 7.1% lower. The negative magnitudes are 6.4315 and 8.811 cm, or 27.0% lower. The separate Stage 5 settlement entry of 0 cm does not represent the vertical field. Moment and anchor reaction agree more closely than the movements. Strength, stiffness, undrained settings, staging and toe restraint need consistent definitions to interpret the remaining differences.
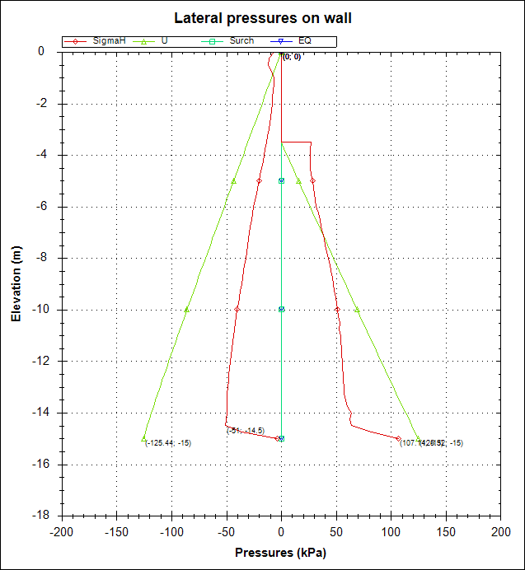
Figures 9 to 16 show the revised DeepEX forces, displacements, lateral pressures and anchor reaction. Table 8 records the Stage 5 summary and design ratios.
Table 10. DeepEX Stage 5 summary for the revised Example 2 model.
Output quantity | Unit | Stage 5 value |
Calculation result | — | Calculated |
Maximum wall displacement | cm | 12.94 |
Settlement summary | cm | 0 |
Wall moment per metre of wall | kN·m/m | 182.68 |
Wall moment total as reported | kN·m | 109.61 |
Wall shear per metre of wall | kN/m | 94.69 |
Wall shear total as reported | kN | 56.82 |
STR combined wall ratio | — | 0.455 |
STR moment wall ratio | — | 0.447 |
STR shear wall ratio | — | 0.088 |
Concrete service stress wall ratio FIC | — | N/A |
Reinforcement service stress ratio FIS | — | N/A |
Maximum support reaction per metre of wall | kN/m | 118.86 |
Maximum support reaction per anchor | kN | 356.58 |
Critical support check | — | 0.682 |
STR support ratio | — | 0.357 |
Support geotechnical capacity ratio for pullout | — | 0.682 |
The 356.58 kN support reaction corresponds to 118.86 kN/m at 3 m anchor spacing. Per-metre values are used for the FEM comparison. The settlement summary is retained as reported and is separate from the vertical field extrema in Table 7.
Example 2. Wall forces
Example 2. Horizontal and vertical displacement
Example 2. Total displacement
Example 2. Wall deflection
Example 2. Lateral pressures and anchor reaction
5. Conclusions
The maximum bending moment differs by 0.2% in Example 1 and 1.4% in the revised Example 2 model. Peak absolute shear is 7.7% lower in DeepEX for Example 1 and 10.5% lower for Example 2. The revised Example 2 anchor reaction is 0.8% lower than Comparison FEM.
The response measures do not agree uniformly. The Example 1 strut reaction is 42.1% lower in DeepEX. In Example 2, the maximum horizontal field displacement is 26.7% higher, while the positive and negative vertical magnitudes are 7.1% and 27.0% lower. The DeepEX Stage 5 wall deflection is 12.94 cm. Agreement in moment and anchor reaction therefore needs to be assessed separately from agreement in the movement field.
The revised Example 2 FEM model uses a clay unit weight of 16 kN/m³, 18 layers with midpoint strength and stiffness values, and a wall toe at the bedrock surface. Its embedment below the excavation base is 11.5 m. Example 1 retains a sand unit weight of 18 kN/m³. Consistent soil inputs, hydraulic conditions, support staging, toe restraint and extraction locations are required for a stronger assessment of equivalence between the two FEM analyses.
References
Fredriksson, A., Kullingsjö, A., Ryner, A., & Stille, H. (2024). Sponthandboken (Rapport 107, revised edition). Pålkommissionen.


