

Example 5: Deadman TERS in Stiff Cohesive Soil
- May 19
- 5 min read
1. INTRODUCTION
This case study involves an excavation of 20 ft on firm clayey soil, followed by a 5 ft sandy backfill and a 306 psf surcharge load placed on top. To retain the excavated soil, a deadman wall system is proposed, with the design focusing on the support system and wall embedment, considering the soil properties and the position of the groundwater table (Figure 1). The analysis is carried out using DeepEX software, applying three methods: the Limit Equilibrium Method (LEM), Non-Linear Analysis (NL), and the Finite Element Method (FEM). The methodology is outlined in the following sections, which detail the assumptions made for each method based on the software settings, the adopted retaining and support system, and the corresponding results.

2. ABOUT DEEPEX
DeepEX is a superior software solution for the design, analysis, and optimization of deep excavation projects and tunnels. Its superior interactive interface allows users to generate, analyze, review, and evaluate any model quickly and efficiently.
Implemented analysis methods: Limit Equilibrium, Non-Linear analysis (soil springs), and 2D & 3D Finite Element analysis.
Implemented soil pressure methods (LEM): Active/Passive, At-rest, FHWA Apparent, German EAB, Custom Trapezoidal, 2-step Rectangular, WMATA, NYC and more.
Implemented water pressure methods: Hydrostatic, Simplified flow, Full 2D flownet, Balanced pressures, unconfined flow.
Beam analysis methods (LEM): Blum’s method (continuous beam), FHWA simple span, CALTRANS, WMATA, and more.
3. SOIL PROPERTIES
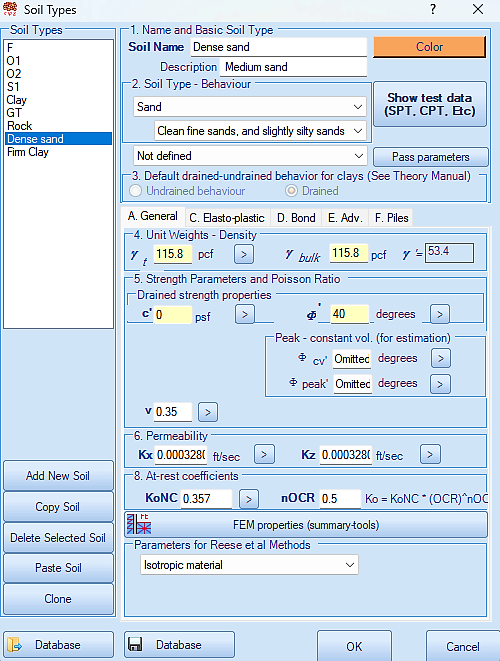
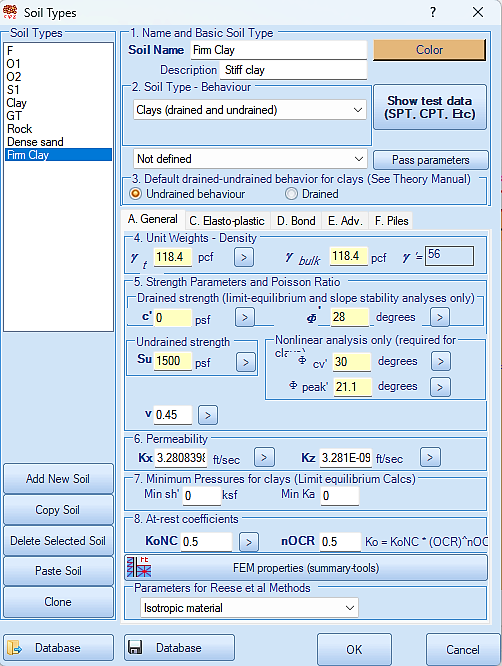
The backfill soil is characterized by a friction angle of 40° and a moist unit weight of 115.8 pcf (Figure 2.a), while the excavated ground consists of firm clay with an undrained shear strength of 1500 psf and a saturated unit weight of 118.4 pcf (Figure 2.b).

a)


b)
Figure 2 – Input window for soil properties definition; a) backfill, b) firm clay.
The problem proposes a minimum fluid pressure of 31.8 pcf (0.0318 ksf), modelled as a minimum driving pressure that increases with depth (Figure 3).

4. WALL SECTION PROPERTIES
The retaining wall consists of AZ 25 section sheet piles, as shown in Figure 4, with its geometry and material properties detailed in Figure 5.

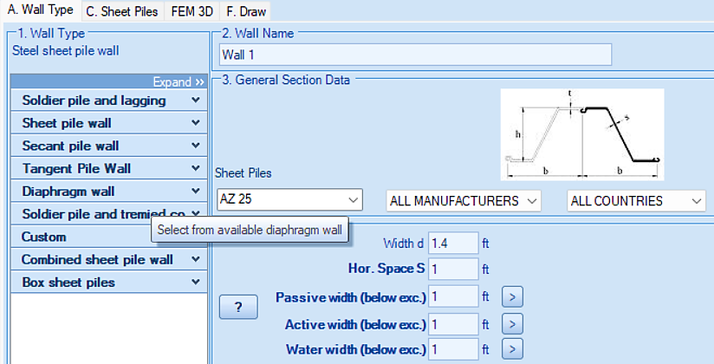


Figure 4 – Geometry of the sheet piles section.


Figure 5 – Sheet piles configurations and material properties.
5. SUPPORT CONFIGURATIONS
The support system is modelled using a Deadman configuration (Figure 8.a), consisting of a 12 ft long AZ 25 sheet pile wall (properties shown in Figure 5), which is connected to the main retaining wall by a #14 solid bar. The bar is installed 3 ft below the top of the backfill and spaced at 6 ft intervals horizontally, with its properties detailed in Figure 6.


Figure 6 – Solid bar properties.
6. CONSTRUCTION STAGES
The construction process is carried out in four stages. The first stage involves the installation of the wall (Figure 7.a). In the second stage, the backfill is placed up to a height of 2 ft, and the solid bar is connected (Figure 7.b). The third stage includes completing the backfill to its final level (+5 ft), followed by the activation of the support bar (Figure 7.c). In the fourth and final stage, the excavation is performed, and the surcharge is applied on top of the backfill (Figure 7.d).
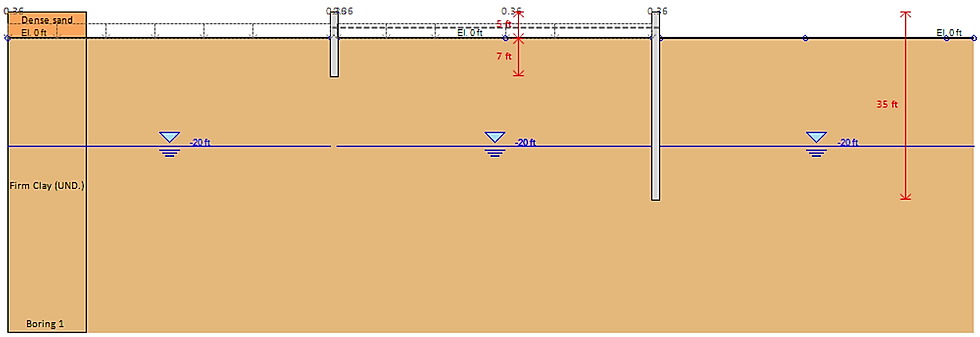


Figure 7 – Model geometry and loading conditions. Initial phase (a), excavation (b).
7. ANALYSIS ASSUMPTIONS
In this example, the following assumptions were made:
Groundwater conditions: The analysis implements simplified flow to represent groundwater behavior effectively.
Support system: Deadman wall with a solid bar connecting to the retaining wall.
Minimum fluid pressures: modelled as a minimum driving pressure, admitted to be a minimum factor that multiplies by depth.
LEM:
Wall friction (δ) is set to 0.
Shear forces, moments and support reaction was performed with Blum's method.
Soil pressures: active and passive.
Optimization of wall embedment for FS = 1.5.
N-L and FEM: Wall friction (δ) is set to 33% of the soil’s friction angle (ϕ').
FEM: medium refinement of finite element mesh.
7. DEEPEX ANALYSIS RESULTS
As result from the optimization of wall embedment for a FS = 1.6, D = 5 ft, the necessary to fulfil all the verifications for the retaining wall performance.
A. Limit Equilibrium Analysis -(show moments and horizontal pressures (Figure 8), shear stress (Figure 9).


B. Non-Linear Analysis -(soil springs) (show moments and horizontal pressures (Figure 10), shear stress and displacements (Figure 11))


C. Finite Element Analysis - (same as NL analysis (Figure 12, 13) + FEM Mesh, horizontal (Figure 14) & vertical displacement shadings (Figure 15)).


8. ANALYSIS SUMMARY & CONCLUSION
In summary, this case study evaluated the design and performance of an anchored retaining wall system for a 20 ft excavation in firm clay, with a 5 ft sandy backfill and a 306 psf surcharge. Using DeepEX software, three analysis methods (LEM, NL, and FEM) were applied to assess stability and wall behavior. The staged construction process, soil conditions, and support system configuration were carefully considered to ensure a safe and effective design.
The results highlight the importance of method selection and construction sequence in retaining wall performance. Table 1 summarizes the outcomes from all analysis methods. The differences in the calculated maximum moments across the three methods—LEM, Non-Linear (beam on elastoplastic foundation), and FEM—are primarily due to how each method accounts for soil-structure interaction and wall-to-wall interaction.
In the Finite Element Method (FEM), these interactions are modelled inherently through a continuous representation of the soil and structural elements, allowing forces to redistribute naturally based on stiffness and boundary conditions.
In contrast, the Limit Equilibrium Method (LEM) simplifies the problem by using assumed earth pressure distributions, and wall interactions are introduced manually via pressure diagrams, leading to less accurate representation of force transfer.
The Non-Linear analysis, based on a beam on elastoplastic foundation approach, improves upon LEM by allowing iterative redistribution of soil pressures and capturing non-linear soil behavior, but still idealizes the system as independent springs under the beam, which limits its ability to fully capture the structural interaction between the main wall and the Deadman.
Consequently, FEM typically predicts higher or differently distributed moments due to its more realistic simulation of structural and geotechnical behavior.
Table 2 presents the critical support results obtained from each analysis method, including key verification parameters such as support reactions and capacity ratios (pull out). These results provide information which can be used to assess the adequacy and performance of the support system under the applied loading conditions.
Table 1: Critical wall results for each method.

Table notes:
STR Moment: Moment stress check, assuming constant axial load on wall (demand/capacity).
STR Shear: Shear stress check (shear force demand/wall shear capacity).
Table 2: Critical support results for each method.

Table notes:
STR Support ratio: Critical structural stress check for support (force demand/structural capacity).
Support Geotech capacity ratio: Critical geotechnical capacity stress check (demand/geotechnical capacity).
Critical support check: Critical demand/design capacity ratio (structural or geotechnical).
Let us show you how to reduce your design time by up to 90%!


