

Example 4: Anchored Cantilever TERS in Cohesionless Soil
- May 19
- 4 min read
1. INTRODUCTION
The present case involves a 20-foot-deep excavation in cohesionless soil. The soil properties and groundwater level are illustrated in Figure 1. The proposal suggests using an anchored wall as a retaining solution, positioned 2 feet from the top of the excavation. The analysis of this problem is conducted using the Limit Equilibrium Method (LEM), Non-Linear Analysis (NL), and the Finite Element Method (FEM), all of which are implemented in the DeepEX software. The following sections outline the overall framework and present the results of the analysis.

2. ABOUT DEEPEX
DeepEX is a superior software solution for the design, analysis, and optimization of deep excavation projects and tunnels. Its superior interactive interface allows users to generate, analyze, review, and evaluate any model quickly and efficiently.
Implemented analysis methods: Limit Equilibrium, Non-Linear analysis (soil springs), and 2D & 3D Finite Element analysis.
Implemented soil pressure methods (LEM): Active/Passive, At-rest, FHWA Apparent, German EAB, Custom Trapezoidal, 2-step Rectangular, WMATA, NYC and more.
Implemented water pressure methods: Hydrostatic, Simplified flow, Full 2D flownet, Balanced pressures, unconfined flow.
Beam analysis methods (LEM): Blum’s method (continuous beam), FHWA simple span, CALTRANS, WMATA, and more.
3. SOIL PROPERTIES
The soil consists of cohesionless material with a friction angle (ϕ') of 32° and a moist unit weight (γ) of 120 pounds per cubic foot (pcf). The saturated unit weight is (γsat) 133.5 pcf. A soil-wall interface friction angle (δ) of 10° is proposed. Figure 2 illustrates the soil properties shown in the input window.


a) b) c)
Figure 2 – Input window for soil properties definition; a) general definitions, b) Exponential behavior (for B NL FEM analysis), c) wall friction.
4. WALL SECTION PROPERTIES
The retaining wall is composed of AZ 25 section sheet piles, with the configurations displayed in Figure 3, which presents the geometry, and material properties are described in Figure 4.

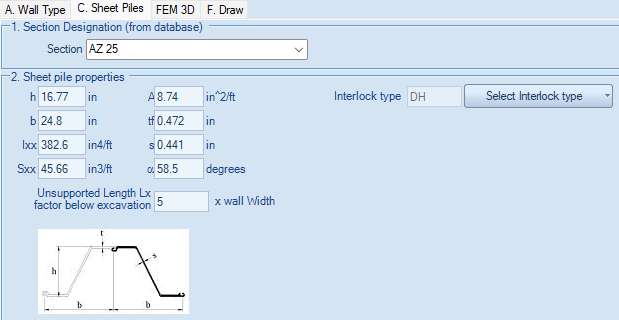

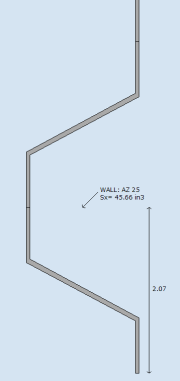
Figure 3 – Geometry of the sheet piles section.

5. SUPPORT
The proposed support is a tieback solution composed of an anchor optimized to 5 strands, with the properties presented in Figure 5.

5. CONSTRUCTION STAGES
The construction process is performed in 3 stages, enabling a sequence that allows the execution of the retaining solution and the placement of the support. This approach ensures the safety of both the site and its surroundings. In the initial phase, stage 0, the software establishes the at-rest conditions (Figure 6.a); stage 1 excavation, to 4 ft (Figure 6.b); stage 2- activation of the support and prestress (for NL and FEM analyses), Figure 6.c; and stage 3 final phase of excavation, to 20 ft (Figure 6.d).


Figure 6 – Model geometry and loading conditions. Initial phase (a), excavation to 4 ft (b), activation of the support and prestress-for NL and FEM (c), final stage of excavation (d).
7. ANALYSIS ASSUMPTIONS
In this example, the following assumptions were made:
Groundwater conditions: The analysis implements simplified flow to represent groundwater behavior effectively.
LEM:
Shear forces, moments and support reaction was performed with Blum's method.
Soil pressures: Active and passive pressure methods; FHWA apparent and Peck 1969 apparent, for comparison.
Optimization of wall embedment for FS = 1.5.
N-L and FEM: Prestress equivalent to 80% of the maximum axial force in the support for LEM analyses.
FEM: medium refinement of finite element mesh.
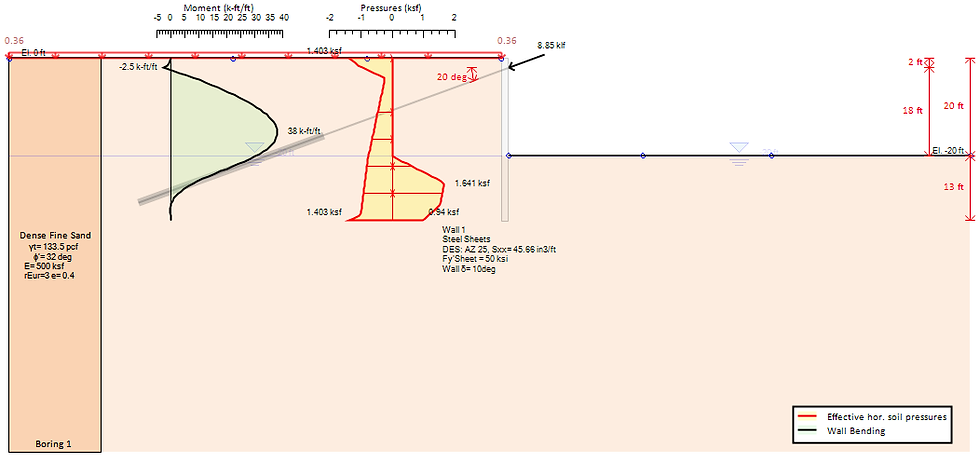
7. DEEPEX ANALYSIS RESULTS
As result from the optimization of wall embedment for a FSmin = 1.5, the embedment is set to D = 13 ft.
A. Limit Equilibrium Analysis -(show moments and horizontal pressures (Figure 7), shear stress (Figure 8), for apparent FHWA pressure as driving pressure (the more unfavorable for the support solicitation), compared to Active-passive and apparent Peck 1969 pressure results presented in Annex A.


B. Non-Linear Analysis - (soil springs) (show moments and horizontal pressures (Figure 9), shear stress and displacements (Figure 10))

C. Finite Element Analysis - (same as NL analysis (Figure 11, 12) + FEM Mesh, horizontal (Figure 13) & vertical displacement shadings (Figure 14)).


8. ANALYSIS SUMMARY & CONCLUSION
The document presents an analysis of an excavation in cohesionless soil with a sloped backfill supported by a cantilever wall as a temporary solution. The results showcase the capabilities of DeepEX software in modeling and analyzing excavations with retaining structures. The analysis employs three different methods available in the software: Limit Equilibrium Method (LEM), Nonlinear (NL), and Finite Element Method (FEM). The findings illustrate the software's versatility in providing reliable design solutions. Table 1 summarizes the outcomes from all analysis methods, detailing the maximum displacements, maximum moments, maximum shear forces, the check ratios for moments and maximum shear stresses, and wall embedment FS. Table 2 displays the results for verifications of the support, such as reaction and capacity ratio.
Table 1: Critical wall results for each method.

Table notes:
STR Moment: Moment stress check, assuming constant axial load on wall (demand/capacity).
STR Shear: Shear stress check (shear force demand/wall shear capacity).
Table 2: Critical support results for each method.

Table notes:
STR Support ratio: Critical structural stress check for support (force demand/structural capacity).
Support Geotech capacity ratio: Critical geotechnical capacity stress check (demand/geotechnical capacity).
Critical support check: Critical demand/design capacity ratio (structural or geotechnical).
ANNEX A – Active drive pressures


Table A.1 – Critical wall and support results for different diving pressures.

Let us show you how to reduce your design time by up to 90%!


