

Example 1: Cantilever TERS in Cohesionless Soil with Level Backfill
- May 19
- 4 min read
1. INTRODUCTION
In this example we will simulate and analyze a cantilever excavation model in DeepEX software, considering all the available analysis methods – Limit Equilibrium, Non-Linear Analysis and Finite Element Analysis. We will illustrate the model geometry assumptions, the analysis assumptions and the analysis results. The example presents a 10 ft depth excavation on a soil characterized by the parameters presented in Figure 1, where it is possible to observe problem sketch. The groundwater level sits at the depth of the excavation, and a minimum surcharge of 360 psf is considered.

2. ABOUT DEEPEX
DeepEX is a superior software solution for the design, analysis, and optimization of deep excavation projects and tunnels. Its superior interactive interface allows users to generate, analyze, review, and evaluate any model quickly and efficiently.
Implemented analysis methods: Limit Equilibrium, Non-Linear analysis (soil springs), and 2D & 3D Finite Element analysis.
Implemented soil pressure methods (LEM): Active/Passive, At-rest, FHWA Apparent, German EAB, Custom Trapezoidal, 2-step Rectangular, WMATA, NYC and more.
Implemented water pressure methods: Hydrostatic, Simplified flow, Full 2D flownet, Balanced pressures, unconfined flow.
Beam analysis methods (LEM): Blum’s method (continuous beam), FHWA simple span, CALTRANS, WMATA, and more.
3. SOIL PROPERTIES
The soil is characterized by a friction angle of 32º, moist unit weight of 120 pcf, and saturated unit weight of 133.5 pcf. Figure 2 presents the soil properties in the input window.


a) b)
Figure 2 – Input window for soil properties definition; a) general definitions, b) Exponential behavior (for NL & FEM analysis).
4. WALL SECTION PROPERTIES
The retaining wall is composed of AZ 19 section sheet piles, with the configurations displayed in Figure 3, which presents the geometry, and material properties are described in Figure 4.

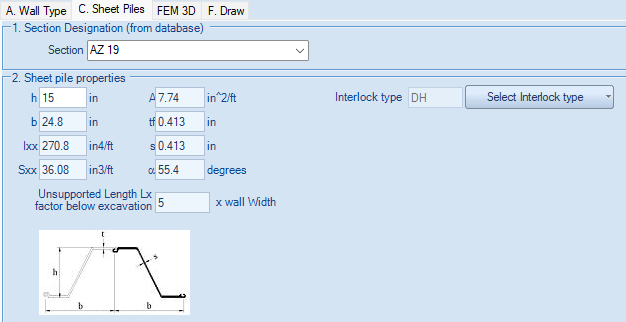

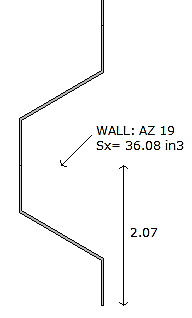
Figure 3 – Geometry of the sheet piles section.

5. EXTERNAL LOADS
In the present example, a 360 psf surcharge pressure is applied to the surface, and modeled as a field surcharge (Figure 5). This is illustrated in Figure 6.a, which visually represents the load distribution.

6. CONSTRUCTION STAGES
The construction process is carried out in stages, enabling a gradual transfer of the load to the retaining structure. This approach ensures the safety of both the site and its surroundings. In the initial phase, the software establishes the at-rest conditions (refer to Figure 6.a). In the subsequent step, the retaining wall is subjected to the soil pressures and surface surcharge (see Figure 6.b).


Figure 6 – Model initial geometry and loading conditions. Initial phase (a), excavation (b). Initial D = 20 ft.
7. ANALYSIS ASSUMPTIONS
In this example, the following assumptions were made:
Groundwater conditions: The analyzes implement Simplified flow to represent groundwater behavior effectively.
LEM:
o Wall friction (δ) is set to 0.
o Shear forces, moments and support reaction was performed with Blum's method.
o Soil pressures: Active and passive pressure methods.
o Optimization of wall embedment for FS = 1.5.
• N-L and FEM: Wall friction (δ) is set to 33% of the soil’s friction angle (ϕ').
• FEM: medium refinement of finite element mesh.
8. DEEPEX ANALYSIS RESULTS
As result from the optimization of wall embedment for a FSmin = 1.5, the embedment increased to D = 22 ft.
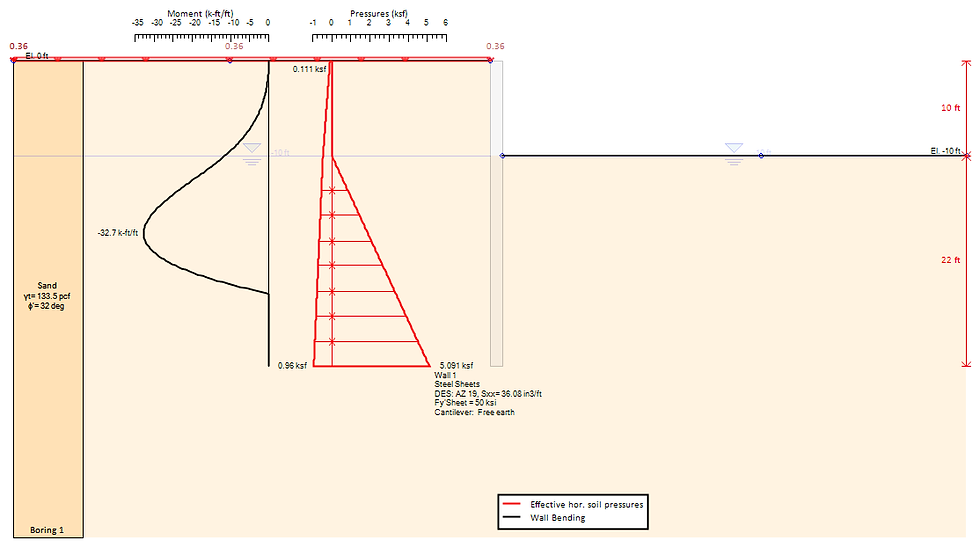
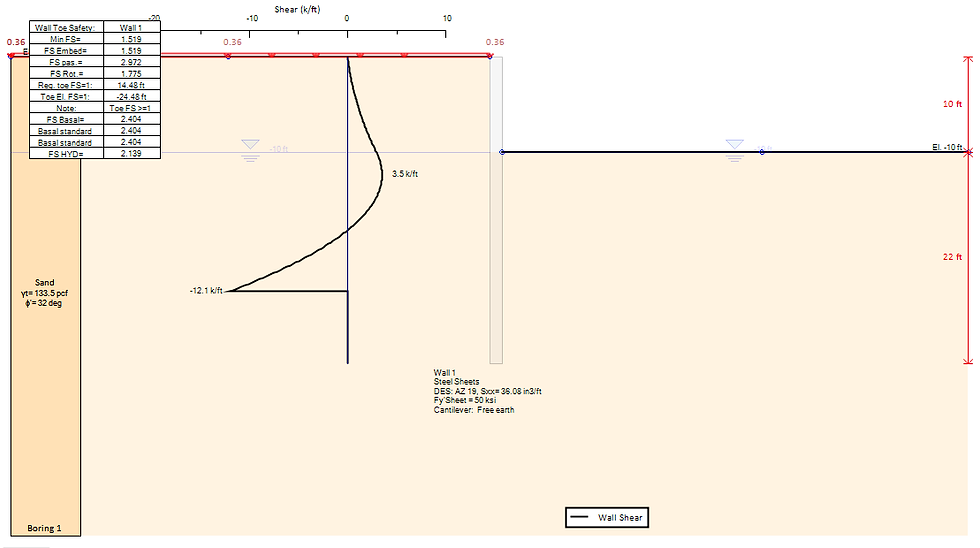
A. Limit Equilibrium Analysis -(show moments and horizontal pressures (Figure 7), shear stress (Figure 8).
B. Non-Linear Analysis - (soil springs) (show moments and horizontal pressures (Figure 9), shear stress and displacements (Figure 10))


C. Finite Element Analysis - (same as NL analysis (Figure 11, 12) + FEM Mesh, horizontal (Figure 13) & vertical displacement shadings (Figure 14)).


9. ANALYSIS SUMMARY & CONCLUSION
The current document highlights the capabilities of the software DeepEX, which excels in modeling and analyzing excavations with retaining structures. This software offers essential tools, including various retaining wall systems and configurations that can be adapted to meet specific project requirements. In this example, the model was analyzed using three different methods. The results demonstrate the software's versatility in implementing solutions for reliable design. Table 1 summarizes the outcomes from all analysis methods, detailing the maximum displacements, maximum moments, maximum shear, the check ratios for moments and maximum shear stresses, and wall embedment FS.
Table 1: Extended summary for all design sections.

Table notes:
STR Moment: Moment stress check, assuming constant axial load on wall (demand/capacity). STR Shear: Shear stress check (shear force demand/wall shear capacity).
Let us show you how to reduce your design time by up to 90%!


