

Evaluation of a Deep Excavation in Jakarta, Indonesia
- Oct 16, 2023
- 9 min read
Updated: Nov 9, 2023
Excavation in Jakarta - Displacement Prediction with Different Analysis Methods
A. INTRODUCTION
A deep excavation in Jakarta Indonesia experienced significantly greater deformations vs. the design levels as presented in the paper “Back calculation of excessive deformation on deep excavation” by M.F. Ma’ruf and H. Darjanto.
The original authors recalibrated soil properties and benchmarked the measured response by adjusting soil properties in a finite element analysis model using the Mohr Coulomb model.
Our review indicated that the deformations could have been predicted by using the original soil properties and with minor modelling adjustments using even only Limit-Equilibrium methods or non-linear analysis Winkler methods.
Using the hardening soil model with the original soil strength properties also produced far better agreement vs. the Mohr Coulomb.
The construction sequence of the deep basement included an 8m cantilever excavation supported by a 1V:1H bench from that elevation until the final excavation depth of 12.4 m, followed by the installation of a raker support.
The paper presents a back analysis with a FEM software (Plaxis 2D) and the comparison between the estimated displacements versus the measured values from the project site.
Table 1 presents the original soil properties used in the original analysis and in our reanalysis.
Figure 1 presents the original model.
Table 1: Soil Properties for Existing Design
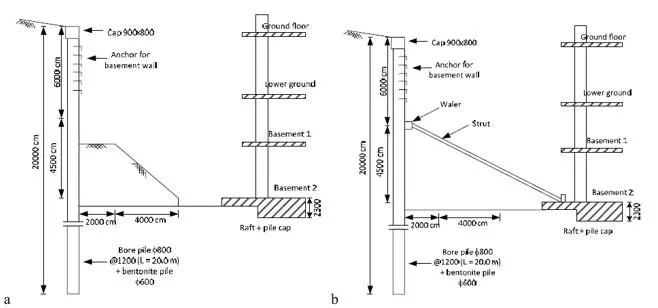
Figure 1: The cutoff wall system: a) 8m Cantilever with the supporting bench, b) Raker installation and bench removal.
B. ORIGINAL PROJECT – MEASURED DISPLACEMENTS AND BENDING MOMENTS
Figure 2 presents the monitoring stations around the project area, as well as the measured displacements as presented in the original paper.
We notice that in the middle-wall locations the measured displacements were close to 33cm, greatly exceeding the predicted displacements from the original design (120mm).

Figure 2: a) Monitoring Stations, b) Measured Displacements through Time for each Station.
C. EVALUATION WITH A FEM SOFTWARE (PLAXIS 2D FROM THE ORIGINAL PAPER)
The original paper presented a simplified model simulation with a FEM software (Plaxis 2D) with benchmarked Mohr-Coulomb soil model properties (i.e. different than the original design).
The reported model was a simplified case, without considering the intermediate construction stages the raker support, or any external surcharges on the model and produced a maximum horizontal wall displacement of approximately 31cm.
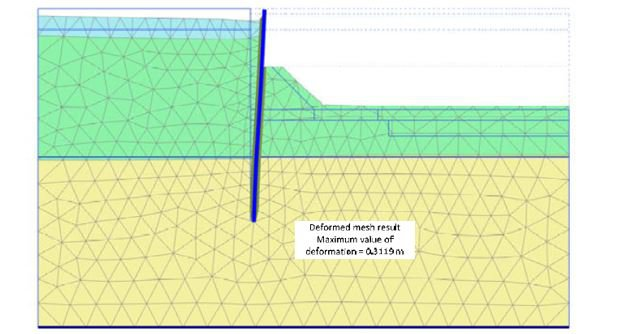
Figure 3: Model Simulation with a 2D FEM Software.
D1. SIMULATION IN DEEPEX SOFTWARE – CONSTRUCTION STAGES
The same model was simulated in DeepEX – Shoring Design software considering all construction stages and the raker.
DeepEX allows us to generate any excavation model graphically and quickly examine different analysis methods, cases, and scenarios, leading to a complete project design solution.
The following modelling methods were used for the analysis of the excavation: Limit Equilibrium, Non-Linear Analysis with Soil Springs, and Finite Element Analysis.
All methods and design sections were examined in a single file.
This way the most critical conditions can be easily revealed without resorting to reviewing different files.
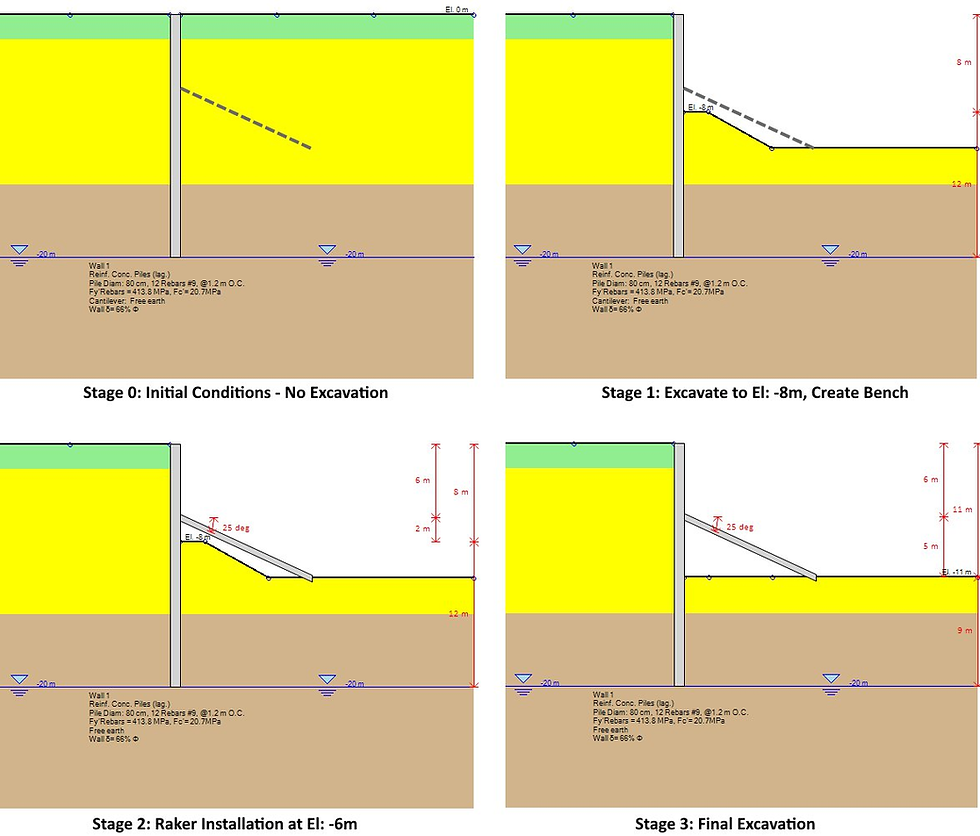
Figure 4: The model as created in DeepEX software – All Construction Stages.
D2. SIMULATION IN DEEPEX SOFTWARE – WALL PROPERTIES
The shoring wall comprised of concrete soldier piles (800mm diameter piles @ 1200mm spacing), without any reference on the reinforcement and the material properties.
In DeepEX software we assumed the wall properties as presented in Table 2 below.
Figure 5 presents the wall section options in our software.
Table 2: Wall Properties
Wall Type | Soldier Pile Wall with Timber Lagging |
Wall Pile Section | 80cm Thick Concrete Piles |
Longitudinal Reinforcement | |
Shear Reinforcement | |
Lagging | 4’’ Concrete Lagging |
Materials | Beams: A50 Steel, Rebars: Grade 60 , Concrete: 4 ksi |
Top Wall Elevation | 0 ft |
Total Wall Depth | 35 ft |

Figure 5: Wall Section Properties in DeepEX Software
D3. SIMULATION IN DEEPEX SOFTWARE – SOIL PROPERTIES & STRATIGRAPHY
In the generated model, we used the original soil properties as presented in Table 1.
We decided to run the analysis using the soils that were considered during the original project design and not the benchmarked, simply to illustrate that even with these properties, with a complete analysis with different methods the big displacements could be predicted and averted during the initial design and the project construction.

Figure 6: Soil Properties in DeepEX Software – Top Soil C1-Initial

Figure 7: Soil Layer Options in DeepEX Software (Stratigraphy)
E. DEEPEX ANALYSIS – PROJECT EVALUATION WITH ALL METHODS
With the Limit Equilibrium method, the software uses the conventional approach to calculate all pressures that are developed on the wall (earth active and passive side pressures, water pressures, external surcharges, seismic loads).Net pressure diagrams are calculated for each stage.
The software uses the selected beam analysis method to calculate the wall moment and shear diagrams, the support reactions, and the wall embedment safety factors, as well as to estimate the wall displacements.
With the Non-Linear Analysis method, the software uses elastoplastic soil springs to simulate the connection of the soil with the wall.
Soil springs are also used to simulate the connection of the wall with installed supports. The NL method takes into consideration the project construction sequence through staging.
The Winkler springs are initially placed in at-rest conditions, and along the construction stages, springs get activated and deactivated.
The software measures the effect on the springs, and from that loading it calculates all results.
the Finite Element Analysis method, both the structural components and the supporting soil medium are included in the simulation model.
The soil medium is modelled as a continuum while soil properties are introduced through elastoplastic constitutive laws (Mohr Coulomb, Soil Hardening, Hoek Brown etc.). Full soil structure interaction is considered and post processing results within the soil medium can be evaluated.
The range of methods and the user-friendly interface of DeepEX software allow the user to run all methods and evaluate different alternatives.
The following subsections present the analysis settings that were examined with different method on this particular model.
E1. DEEPEX ANALYSIS – LIMIT EQUILIBRIUM METHOD – NO EXTERNAL LOAD – NO WALL FRICTION
In this scenario we examine the classical LEM approach with the following settings:
- Soil Pressures: Active/Passive for the cantilever excavation stage, FHWA Apparent/Passive for stages with supports.
- Beam Analysis: Blum’s Method
- Wall Friction: 0 for the driving/resisting side.
- Water Pressures: Simplified Flow
- Surface Slope = 0 deg
The analysis with the LEM approach with the above assumptions estimates a wall deflection of 35 cm in stage 1 (Cantilever Excavation Stage), as well as excessive moments in the same stage, showing clearly that the big displacements could have been predicted even with the use of a conventional method. Finally, the minimum wall embedment FS for the cantilever stage is 1, which is far less than the typically required value of 1.5.

Figure 8: Wall Displacement and Moment Diagram, Wall Embedment FS - Stage 1 (LEM, Wall Delta = 0, No Slope)
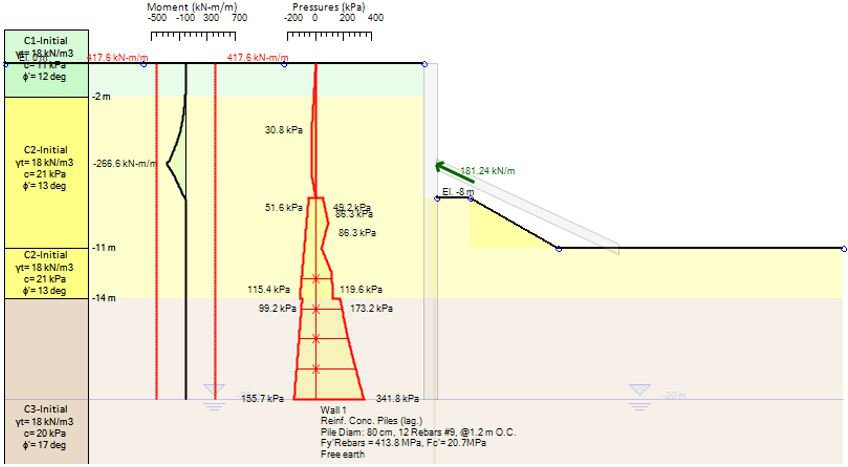
Figure 9: Soil Pressures and Moment Diagram, Support Reaction - Stage 2 (LEM, Wall Delta = 0, No Slope)
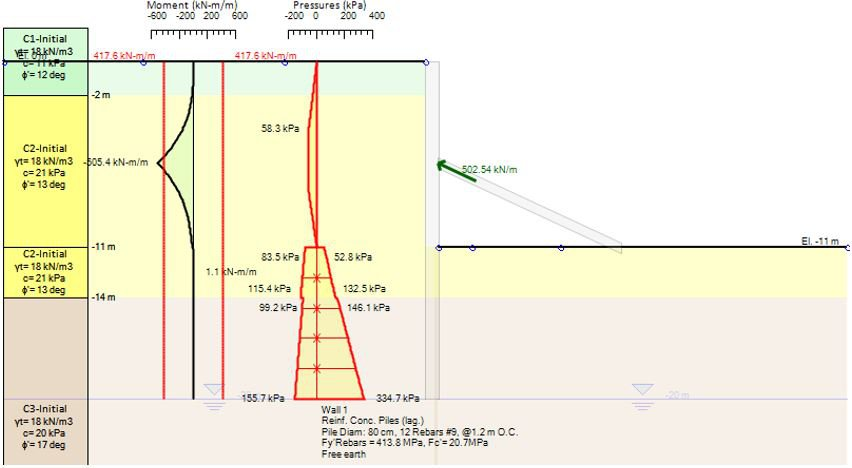
Figure 10: Soil Pressures and Moment Diagram, Support Reaction - Stage 3 (LEM, Wall Delta = 0, No Slope)
E2. DEEPEX ANALYSIS – LIMIT EQUILIBRIUM METHOD – NO EXTERNAL LOAD – WALL FRICTION 33% OF SOIL φ
In this scenario we examine the effect of applying wall friction to the model (wall delta = 33% of the soil friction angle).
We will use again the classical LEM approach with the following settings:
- Soil Pressures: Active/Passive for the cantilever excavation stage, FHWA Apparent/Passive for stages with supports.
- Beam Analysis: Blum’s Method
- Wall Friction: 33% of soil friction for the driving/resisting side.
- Water Pressures: Simplified Flow
- Surface Slope = 0 deg
The analysis with the LEM approach with above assumptions estimates a wall deflection of 12.7 cm in stage 1 (Cantilever Excavation Stage), and a minimum wall embedment FS = 1.34 < 1.5 for that stage. This case shows the impact of wall friction on the calculated results in such models.

Figure 11: Wall Displacement and Moment Diagram, Wall Embedment FS - Stage 1 (LEM, Wall Delta = 33% of φ, No Slope)
E3. DEEPEX ANALYSIS – LIMIT EQUILIBRIUM METHOD – WALL FRICTION 33% OF SOIL φ – INCLINED SOIL SURFACE
In the project image we can notice that the soil on the left side of the model (uphill) forms a small slope. The paper does not provide any information about this slope surface and whether or not it was included in the original project design, and totally disregards it in the checked model.
In this scenario we include a small slope angle for the soil surface (5 deg) to check the impact of the excessive soil on our model.
We will use again the classical LEM approach with the following settings:
- Soil Pressures: Active/Passive for the cantilever excavation stage, FHWA Apparent/Passive for stages with supports.
- Beam Analysis: Blum’s Method
- Wall Friction: 33% of soil friction for the driving/resisting side.
- Water Pressures: Simplified Flow
- Surface Slope = 5 deg
The analysis with the LEM approach with the above assumptions estimates a wall deflection of 22.2 cm in stage 1 (Cantilever Excavation Stage). This result outlines the impact on a deep excavation model of external surcharges and a realistic representation of the existing soil surface conditions.

Figure 12: Wall Displacement & Moment Diagram, Wall Embedment FS - Stage 1 (LEM, Wall Delta = 33% of φ, 5deg Slope)
E4. DEEPEX ANALYSIS – NON-LINEAR ANALYSIS – NO EXTERNAL LOAD – NO WALL FRICTION
In this scenario we examine the model response with the Non-Linear analysis approach (elastoplastic soil springs), with the following settings:
- Soil Model (all soils): Elastic-Plastic.
- Wall Friction: 0 for the driving/resisting side.
- Water Pressures: Simplified Flow
- Surface Slope = 0 deg
The analysis with the NL approach with the previous assumptions mentioned produces a maximum wall deflection of 77.39 cm in stage 1 (Cantilever Excavation Stage). In general, the NL analysis can produce quite realistic displacement graphs if we define realistic soil properties. Such big displacements are expected when we use the soil springs method without any wall friction – some wall friction is always expected and required in these methods (NL, FEM), since it helps a lot with the model convergence, and it can produce more realistic displacement graphs.

Figure 13: Wall Displacement & Moment Diagram - Stage 1 (NL Analysis, Wall Delta = 0, No Slope)
E5. DEEPEX ANALYSIS – NON-LINEAR ANALYSIS – NO EXTERNAL LOAD – WALL FRICTION 33% OF SOIL φ
In this scenario we examine the model response with the Non-Linear analysis approach (elastoplastic soil springs) with wall friction with the following settings:
- Soil Model (all soils): Elastic-Plastic.
- Wall Friction: 33% of the soil friction angle for the driving/resisting side.
- Water Pressures: Simplified Flow
- Surface Slope = 0 deg
The analysis with the NL approach with the previous assumptions produces a wall deflection of 14.1 cm in stage 1 (Cantilever Excavation Stage), which is considerably smaller than the case without any wall friction.
This illustrates the great effect that the wall friction can have on the analysis.
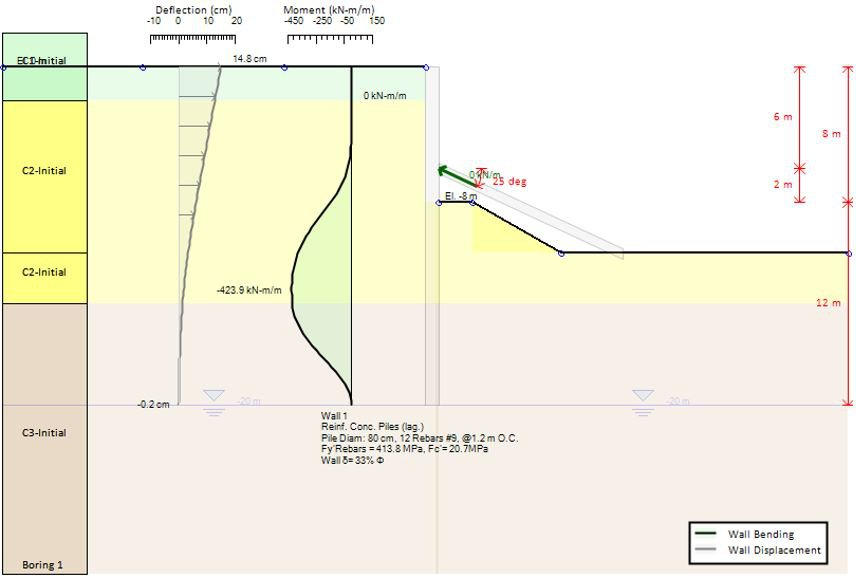
Figure 14: Wall Displacement & Moment Diagram - Stage 1 (NL Analysis, Wall Delta = 33% of φ, No Slope)
E6. DEEPEX ANALYSIS – NON-LINEAR ANALYSIS – WALL FRICTION 33% OF SOIL φ – INCLINED SOIL SURFACE
In this scenario we include a small slope angle for the soil surface (5 deg) to check the impact of the excessive soil on our model on the Non-Linear analysis approach (elastoplastic soil springs) with the following settings:
- Soil Model (all soils): Elastic-Plastic.
- Wall Friction: 33% of the soil friction angle for the driving/resisting side.
- Water Pressures: Simplified Flow
- Surface Slope = 5 deg
The analysis with the NL approach with the previous assumptions estimates a wall deflection of 32 cm in stage 1 (Cantilever Excavation Stage), which is very close to the measured settlements in the project area. This result outlines the impact on a deep excavation model of external surcharges and a realistic representation of the existing soil surface conditions, combined with an advanced analysis method like the Non-Linear analysis approach.

Figure 15: Wall Displacement & Moment Diagram - Stage 1 (NL Analysis, Wall Delta = 33% of φ, 5deg Slope)
E7. DEEPEX ANALYSIS – FINITE ELEMENTS (MOHR-COULOMB) – WALL FRICTION 33% OF SOIL φ – INCLINED SOIL SURFACE
In this scenario we analyzed the model with wall friction and surface slope, using the DeepFEM engine (DeepEX Finite Element Analysis). In this first FEM model we will consider elastoplastic behavior for our soil materials (linear elastic – perfectly plastic soil model, Mohr-Coulomb constitutive laws).
- Soil Model (all soils): Elastic-Plastic.
- Non-Linear Solver: Krylov-Newton Method
- Wall Friction: 33% of the soil friction angle for the driving/resisting side.
- Water Pressures: Simplified Flow
- Surface Slope = 5 deg
This analysis with the FEM approach with the above settings mentioned estimates a wall deflection of 22.4 cm in stage 1 (Cantilever Excavation Stage), which is significantly higher than the expected displacements for that stage in the original design (120 mm).

Figure 16: Generated Mesh, Wall Displacement & Moment Diagram - Stage 1 (FEM Analysis – Elastoplastic Soil Models)
E8. DEEPEX ANALYSIS – FINITE ELEMENTS (SOIL HARDENING) – WALL FRICTION 55% OF SOIL φ – INCLINED SOIL SURFACE
In the last scenario examines a model with wall friction and surface slope, using the DeepFEM engine (DeepEX Finite Element Analysis). In this FEM model we will consider exponential soil hardening behavior for our soil materials. This approach can provide more realistic displacements results and describes better the actual soil behavior.
- Soil Model (all soils): Hyperbolic Exponential - Soil Hardening
- Non-Linear Solver: Krylov-Newton Method
- Wall Friction: 55% of the soil friction angle for the driving/resisting side.
- Surface Slope = 5 deg
The analysis with the FEM approach with the above assumptions estimates a wall deflection of 57 cm in stage 1 (Cantilever Excavation Stage), which is significantly higher than the expected displacements for that stage in the original design (120 mm).

Figure 17: Generated Mesh, Wall Displacement & Moment Diagram - Stage 1 (FEM Analysis – Exponential Soil Models)
F. CONCLUSION
Our review of the case history indicated that even with the original soil properties that the designers should have been able to produce adequate estimates of larger wall deformations.
In large cantilever excavations small variations in slope angle and wall friction assumptions can have a significant impact on the produced results.
Designers should be aware of these conditions and examine the sensitivity of their analyses. Highly sensitive designs should be avoided where possible.
Last, geotechnical designers should not solely rely on one analysis method, and especially finite elements.
Finite elements are valuable but should not be the starting point of any analyses. As this report confirmed, with finite elements selecting the correct soil model can have a significant impact.


