

Effect of Surcharge Analysis on Cantilever Excavation Design
- Oct 16, 2023
- 3 min read
Updated: May 4
A. Introduction
Selecting the appropriate surcharge method can have a significant impact in cantilever sheet pile design.
In this article we examine the impact of several external surcharge distribution approaches on the design of a cantilever excavation system.
Different scenarios for an external distributed surcharge and a 3-Dimensional load are considered. The wall embedment and sheet pile section is optimized for each case with our shoring design software – DeepEX.
Tables 1 and 2 summarize assumed soil layer and initial wall section properties respectively.
Figure 1 presents the generated model in DeepEX.
Table 1: Soil Layers (Stratigraphy) – Soil Properties
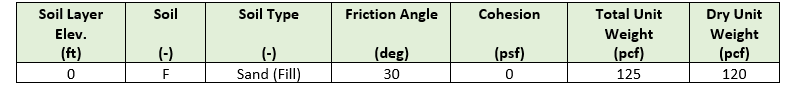
Table 2: Default Wall Properties


Figure 1: Cantilever Sheet Pile Wall – DeepEX Model
B. Examined External Surcharge Cases
The following cases are evaluated:
Case 1: Distributed Surface Load – Elasticity Equations (Boussinesq etc.)
Case 2: Distributed Surface Load – 2-Way Distribution Method
Case 3: Distributed Surface Load – 1-Way Distribution Method
Case 4: Distributed Surface Load – Elasticity Equations x2 (AREMA Specifications)
Case 5: 3D Load (Footing) – Distributed Load – Elasticity Equations
Case 6: 3D Load (Footing) – Distributed Load – 2-Way Distribution from Soil Friction
The following figures illustrate the related settings both for the external strip load and for the 3-D Footing load in DeepEX Software.

Figure 2: Distributed Load Settings & External Load Analysis Options – DeepEX Software

Figure 3: 3D Footing Load Settings & Analysis Options – DeepEX Software
C. Analysis Settings
All the examined case models will be analyzed with the Free Earth Method for cantilever excavations (LEM approach) assuming a wall-soil interface friction angle at 33% of the soil friction angle.

Figure 4: Analysis Settings in DeepEX Software
Wall embedment will be optimized by requiring a minimum wall embedment FS of 1.5 on rotation.

Figure 5: Automatic Depth Optimization Options in DeepEX
D. Analysis Results & Wall Optimization
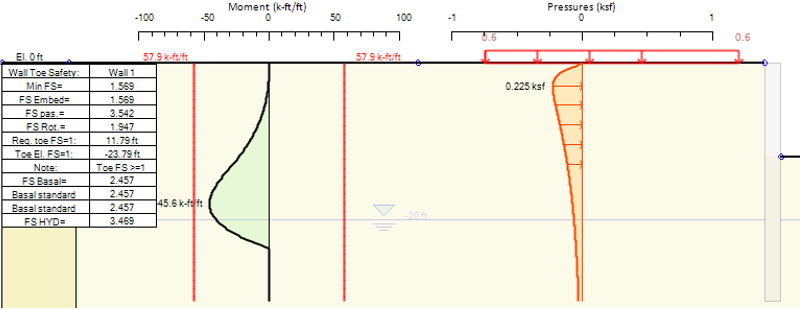
Figure 6: Case 1 – Elasticity Equations: Wall Embedment FS, Wall Moment & Surcharge Pressure Diagrams
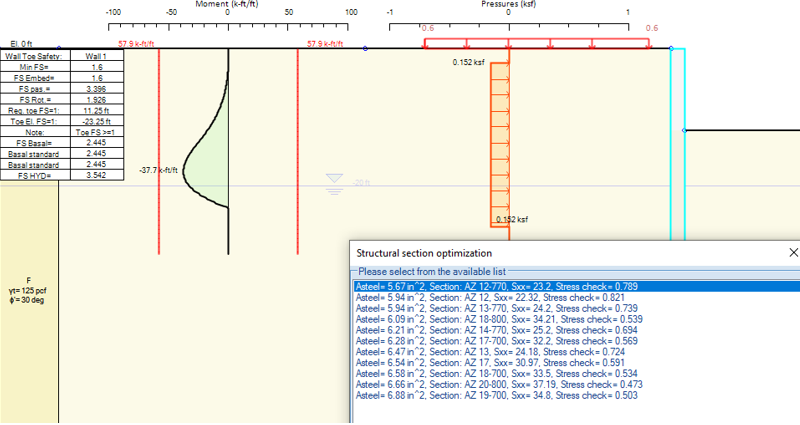
Figure 7: Case 2 – 2-Way Distribution: Wall Embedment FS, Wall Moment & Surcharge Pressure Diagrams, Pile Section Optimization Options

Figure 8: Case 3 – 1-Way Distribution: Wall Embedment FS, Wall Moment & Surcharge Pressure Diagrams

Figure 9: Case 4 – Elasticity x2 (AREMA): Wall Embedment FS, Wall Moment & Surcharge Pressure Diagrams
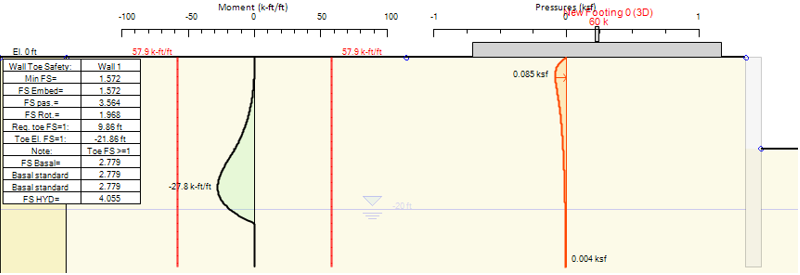
Figure 10: Case 5 – 3D Footing – Elasticity Equations: Wall Embedment FS, Wall Moment & Surcharge Pressure Diagrams
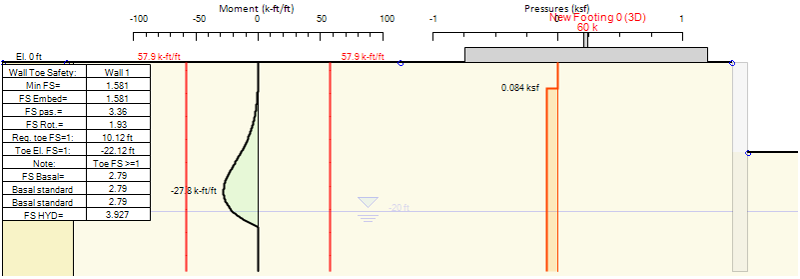
Figure 11: Case 6 – 3D Footing – 2-Way Distribution from Soil Friction: Wall Embedment FS, Wall Moment & Surcharge Pressure Diagrams
E. Analysis Summary & Conclusions
Table 3 summarizes the calculated maximum moments, the minimum required wall embedment depths and the optimum structural section for each load case.
Table 3: Analysis Summary
| Optimum Wall Embedment | Min Wall Embedment FS | Optimum Structural Section | Maximum Moment | Moment Check Ratio |
Case 1 | 18.5 ft | 1.569 | AZ12-770 | 45.6 ksf | 0.788 |
Case 2 | 18 ft | 1.6 | AZ12-770 | 37.7 ksf | 0.651 |
Case 3 | 18.5 ft | 1.569 | AZ12-770 | 41.9 ksf | 0.723 |
Case 4 | 22 ft | 1.57 | AZ20-800 | 74.5 ksf | 0.803 |
Case 5 | 15.5 ft | 1.572 | AZ12-770 | 27.8 ksf | 0.48 |
Case 6 | 16 ft | 1.581 | AZ12-770 | 27.8 ksf | 0.48 |
From all the above examined scenarios it is clear that the selection of the surcharge distribution approach can have a big impact on the design project’s cost.
Our clients and our workshop participants already know the best method!
Sign up for a free trial and learn what method you should use in your shoring design projects!


