

Cantilever secant pile wall
Updated: Aug 13
Comparative analysis of a cantilever secant pile wall using LEM, NL, and FEM
Introduction
Cantilever retaining walls rely entirely on wall stiffness and the passive resistance mobilized below the excavation level. Because no anchors, struts, or other supports are installed, the embedded portion of the wall must provide sufficient resistance against translation and rotation while limiting bending moments and horizontal movements.
This example compares the response of a cantilever secant pile wall using three analysis methods available in DeepEX:
Limit equilibrium method (LEM), using the fixed-earth method
Nonlinear analysis (NL)
Finite element method (FEM).
The same excavation geometry, soil profile, wall section, groundwater level, and construction sequence are maintained in the three analyses. The comparison focuses on wall moments, shear forces, horizontal displacements, earth-pressure distributions, structural utilization, and embedment stability.
A. Analysis Description
The model represents a 7.50 m deep unsupported excavation retained by a reinforced-concrete secant pile wall. The wall extends 7.00 m below the final excavation level, resulting in a total wall length of 14.50 m.
The groundwater level is located at elevation m, approximately 3.00 m below the wall toe. Groundwater therefore does not act directly on the retained height or the embedded wall section in this example.

Model Geometry
Table 1. Principal dimensions adopted in the cantilever wall model.
Parameter | Adopted value |
Excavation depth | 7.50 m |
Wall type | Reinforced-concrete secant pile wall |
Number of support levels | 0 |
Wall embedment below excavation | 7.00 m |
Total wall length | 14.50 m |
Wall toe elevation | m |
Groundwater elevation | m |
Pile diameter | 0.60 m |
Horizontal pile spacing | 0.60 m |
Active width below excavation | 0.60 m |
Passive width below excavation | 0.60 m |
Water width below excavation | 0.60 m |
The excavation is performed progressively to depths of approximately 2.0, 4.0, 6.0, and 7.5 m. Because the wall is unsupported, its response develops continuously as the excavation advances and passive resistance is mobilized below the excavation level.
Soil Profile
The ground profile comprises fill, medium sand, stiff clay, and glacial till. The final excavation level is located within the medium-sand layer, while the wall toe is embedded approximately 4.50 m into the underlying stiff clay.
Table 2. Soil strength parameters adopted in the analyses.
Soil | Description | γ(kN/m³) | c'(kPa) | Su(kPa) | φ' |
F | Fill | 19.63 | 0 | — | 30deg |
S1 | Medium sand | 21.00 | 5 | — | 34deg |
Clay | Stiff clay, undrained | 20.00 | — | 150 | 0deg |
GT | Glacial till | 22.00 | 10 | — | 36deg |
For the NL and FEM analyses, stress-dependent soil stiffness is assigned to each layer. The unloading-to-loading stiffness ratio is taken as 3.
Table 3. Soil stiffness parameters adopted in the NL and FEM analyses.
Soil | Reference/loading modulus (MPa) | Stress exponent | Er/Eload |
F | 14.37 | 0.50 | 3.0 |
S1 | 25.00 | 0.40 | 3.0 |
Clay | 20.00 | 1.00 | 3.0 |
GT | 30.00 | 0.40 | 3.0 |
The initial stress and OCR assumptions are kept consistent between the NL and FEM models. For comparability with the preceding example, the wall–soil interface friction in the frictional layers may be represented as:
δ = 0,66 φ'
Wall Properties
The retaining wall consists of reinforced-concrete piles with a nominal diameter and horizontal spacing of 0.60 m. An effective concrete percentage of 70% is adopted in the calculation section.
Table 4. Structural properties of the secant pile wall.
Property | Adopted value |
Pile diameter | 60 cm |
Pile horizontal spacing | 60 cm |
Gross concrete area | 2,827.43 cm² |
Gross second moment of area, | 636,172.51 cm⁴ |
Effective concrete percentage | 70% |
Longitudinal reinforcement | 6 No. 10 bars |
Longitudinal reinforcement area | 49.16 cm² |
Reinforcement cover | 7.62 cm |
Shear reinforcement | No. 6 spiral |
Spiral reinforcement area | 2.84 cm² |
Spiral spacing | 12 cm |
B. Methodology
The excavation is analyzed using LEM, NL, and FEM. Since there are no structural supports, equilibrium and displacement control depend on the flexural response of the wall and the resistance mobilized within the embedded section.
Construction Sequence
The following construction sequence is adopted :
Establish the initial ground and in-situ stress conditions.
Install the reinforced-concrete secant pile wall.
Excavate to approximately 2.0 m below ground level.
Continue excavation to approximately 4.0 m.
Continue excavation to approximately 6.0 m.
Complete the excavation to elevation m.
Evaluate the final wall forces, displacements, earth pressures, and toe stability.
No anchors, struts, or prestressing forces are included.

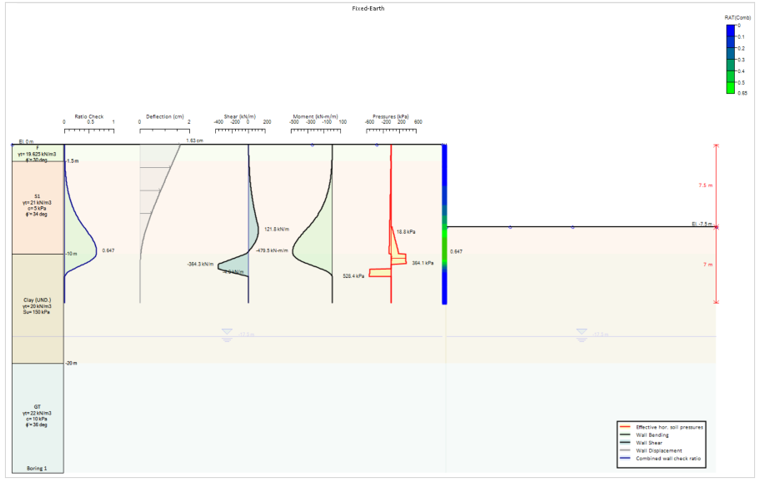
Limit Equilibrium Analysis
The LEM analysis is performed using the fixed-earth method. The retained soil applies lateral pressure to the wall, while passive resistance is mobilized within the embedded section. The embedded part of the wall is assumed to provide sufficient restraint to develop a fixed-earth response.
The method evaluates :
Structural wall deflection under the calculated pressures;
Active and passive pressure distributions;
Required embedment;
Passive, rotational, and basal stability;
Combined structural utilization of the wall.
The fixed-earth method does not explicitly model the continuous stress–strain response of the ground. The calculated deflection should therefore be treated as a structural response under the prescribed earth pressures rather than as a complete soil–structure interaction prediction.
Nonlinear Analysis
The NL analysis represents the soil response using nonlinear springs distributed along the wall. Soil resistance is progressively mobilized as the wall deflects during the excavation sequence.
The principal assumptions include :
Explicit excavation staging;
No structural supports or applied prestress;
Stress-dependent soil stiffness;
Unloading-to-loading stiffness ratio equal to 3;
Initial lateral stresses based on the adopted and OCR conditions;
Nonlinear mobilization of active and passive resistance;
Wall–soil interaction according to the assigned interface properties.
Unlike LEM, the NL method allows earth pressures to redistribute according to the calculated wall movement.

Finite Element Analysis
The FEM model represents the soil as a continuum and incorporates the wall and soil–wall interfaces directly within the numerical domain. Each excavation stage is simulated by deactivating the corresponding soil elements.
The FEM assumptions include :
The same soil strength and stiffness parameters adopted in the NL model;
Consistent initial stress and OCR conditions;
No structural supports or prestressing;
Staged excavation and stress relief;
Soil–wall interface behavior;
Mesh refinement around the wall and excavation;
Boundaries located sufficiently far from the excavation to limit their influence.
In addition to wall forces and displacements, FEM can provide stress changes, plastic zones, and ground movements throughout the surrounding soil mass.


Summary of Modelling Assumptions
Table 5. Principal assumptions adopted in the three analysis methods.
Modelling aspect | LEM | NL | FEM |
Retaining system | Cantilever wall | Cantilever wall | Cantilever wall |
Structural supports | None | None | None |
Soil representation | Active and passive pressures | Nonlinear soil springs | Continuum elements |
Wall analysis | Fixed-earth method | Beam supported by nonlinear springs | Structural element within soil continuum |
Soil stiffness | Not explicitly represented | Stress dependent | Stress-dependent constitutive response |
Initial stresses | Earth-pressure coefficients | and OCR | Generated using and OCR |
Passive resistance | Prescribed pressure distribution | Mobilized with wall movement | Mobilized through continuum response |
Construction staging | Simplified staged equilibrium | Explicit | Explicit |
Wall displacement | Method-dependent structural deflection | Calculated | Calculated |
Ground movement | Not calculated | Not calculated throughout soil domain | Calculated throughout soil domain |
Embedment stability | Explicit toe safety checks | Reflected in soil-spring response | Reflected in continuum response |
2. Results and Discussion
The three methods produce different wall forces, pressure distributions, and displacement predictions. LEM gives the highest bending moment, shear force, passive pressure, and structural utilization, while FEM gives the largest wall displacement.
Main Results
Table 6. Comparison of the principal results at the final excavation stage.
Result | Unit | Fixed-earth LEM | NL | FEM |
Maximum absolute wall moment | kN·m/m | 479.5 | 340.5 | 267.8 |
Maximum absolute wall shear | kN/m | 364.3 | 115.7 | Not labelled¹ |
Maximum wall displacement | cm | 1.63² | 5.20 | 6.66 |
Maximum combined wall check ratio | — | 0.647 | 0.460 | 0.359 |
Maximum displayed soil pressure | kPa | 528.4 | 209.8 | 225.2 |
Wall embedment below excavation | m | 7.00 | 7.00 | 7.00 |
¹ The maximum FEM shear should be obtained from the detailed numerical results because it is not labelled clearly in the supplied plot.
² The LEM value is a method-dependent structural deflection and is not directly equivalent to the soil–structure interaction predictions from NL and FEM.
Wall Moments and Structural Utilization
The fixed-earth LEM analysis produces the largest maximum wall moment, at 479.5 kN·m/m. The maximum moments calculated using NL and FEM are 340.5 and 267.8 kN·m/m, respectively.
Compared with LEM, the maximum moment is approximately 29% lower in NL and 44% lower in FEM. FEM also gives a maximum moment approximately 21% lower than NL.
This trend is reflected directly in the combined wall check ratios :
LEM: 0.647;
NL: 0.460;
FEM: 0.359.
The wall remains structurally adequate in all three analyses because each combined check ratio is below 1.0. Nevertheless, the fixed-earth method produces the governing structural demand for this model.
The higher LEM moment results partly from the assumed fixed-earth response and the concentrated active and passive pressure distributions required to maintain equilibrium. NL and FEM permit soil resistance to redistribute according to wall movement, soil stiffness, and construction staging.
Wall Shear Forces
The maximum absolute wall shear is 364.3 kN/m in LEM and 115.7 kN/m in NL. The LEM value is therefore more than three times the NL result.
The FEM shear diagram indicates a lower demand than LEM, although its precise maximum is not labelled in the supplied output. The exact FEM value should be extracted from the detailed numerical results before the comparison is published.
The substantial difference in shear forces illustrates the sensitivity of cantilever-wall results to the assumed passive-pressure distribution and the manner in which soil resistance is mobilized below the excavation level.
Wall Displacements
The maximum reported wall displacements are :
1.63 cm for LEM;
5.20 cm for NL;
6.66 cm for FEM.
The FEM displacement is approximately 28% greater than the NL prediction. Both deformation-based methods therefore indicate considerably greater movement than the structural deflection reported by LEM.
The 1.63 cm LEM value is calculated from the response of the wall to prescribed earth pressures. Because LEM does not explicitly represent the ground stress–strain response, this value should not be considered directly equivalent to the NL and FEM predictions.
For this unsupported excavation, displacement is an important design consideration. Although all three structural check ratios remain below 1.0, the NL and FEM results indicate wall movements of approximately 52 and 67 mm. These values should be assessed against the project-specific serviceability criteria and the tolerance of nearby structures and utilities.
Earth-Pressure Distributions
The maximum displayed soil pressures are 528.4 kPa in LEM, 209.8 kPa in NL, and 225.2 kPa in FEM.
The considerably higher LEM pressure is associated with the concentrated passive resistance required to satisfy equilibrium under the fixed-earth formulation. NL and FEM distribute resistance over the embedded wall according to the calculated movement and soil response.
Peak pressures should not be considered independently. They should be interpreted together with :
The depth over which passive resistance is mobilized;
The resulting bending-moment and shear-force distributions;
Wall displacement;
The assumed soil–wall interface behavior;
The construction sequence.
Wall Toe and Embedment Stability
The fixed-earth analysis provides explicit stability checks for the embedded wall section.
Table 7. Wall-toe safety results obtained from the fixed-earth LEM analysis.
Stability result | Calculated value |
Minimum reported factor of safety | 1.544 |
Embedment factor of safety | 1.544 |
Passive-resistance factor of safety | 9.013 |
Rotational factor of safety | 3.054 |
Basal stability factor of safety | 4.947 |
Embedment required for toe | 4.535 m |
Toe elevation required for | m |
Adopted embedment | 7.000 m |
Adopted toe elevation | m |
The adopted embedment exceeds the embedment required to obtain a toe factor of safety of 1.0 by approximately 2.47 m. Among the reported stability modes, the embedment check governs, with a factor of safety of 1.544.
The passive-resistance, rotational, and basal stability factors are substantially higher. This indicates that the selected embedment provides adequate resistance for the equilibrium conditions represented in the LEM model.
Interpretation of the Differences
The comparison highlights the different ways in which the three methods represent the behavior of a cantilever wall.
LEM provides a direct equilibrium-based assessment and explicit embedment safety checks. For this model, it produces the largest structural forces and combined wall utilization.
NL allows active and passive resistance to develop progressively as the wall moves. It predicts lower structural forces but substantially greater displacement than LEM.
FEM provides the lowest wall moment and structural utilization but the largest displacement. This result demonstrates that a lower structural demand does not necessarily imply a less critical overall response, particularly when serviceability and movement-sensitive structures are considered.
The FEM and NL results remain sensitive to soil stiffness, OCR, initial stresses, interface properties, and the representation of excavation staging. The consistency of these inputs should therefore be confirmed before attributing the differences solely to the analysis method.
3. Conclusions
This example compares a 7.50 m deep cantilever secant pile wall with 7.00 m of embedment using fixed-earth LEM, NL, and FEM analyses.
The fixed-earth method produces the largest structural demand, with a maximum wall moment of 479.5 kN·m/m, a maximum shear of 364.3 kN/m, and a combined wall check ratio of 0.647. The explicit toe stability assessment gives a governing embedment factor of safety of 1.544.
NL predicts a lower maximum moment of 340.5 kN·m/m and a combined wall check ratio of 0.460. FEM produces the lowest maximum moment, at 267.8 kN·m/m, and the lowest wall check ratio, at 0.359.
The displacement trend is reversed. NL and FEM predict maximum wall movements of 5.20 and 6.66 cm, respectively, compared with the method-dependent LEM deflection of 1.63 cm. The FEM result is therefore the most demanding from a deformation perspective.
The comparison demonstrates that structural capacity and serviceability should be assessed separately. In this example, LEM governs the structural wall demand, whereas FEM governs the predicted horizontal movement. For cantilever systems, where no support is available to restrict deformation, both aspects are essential to the final design.
Need more information? Contact us at: support@deepexcavation.com
Let us show you how to reduce your design time by up to 90%!


